

Question: Bedrock 2 a ) Plot the laboratory effective vertical stress vs . void ratio curve on both arithmetic and semilogarithmic graphs. Note: Don't connect the
Bedrock
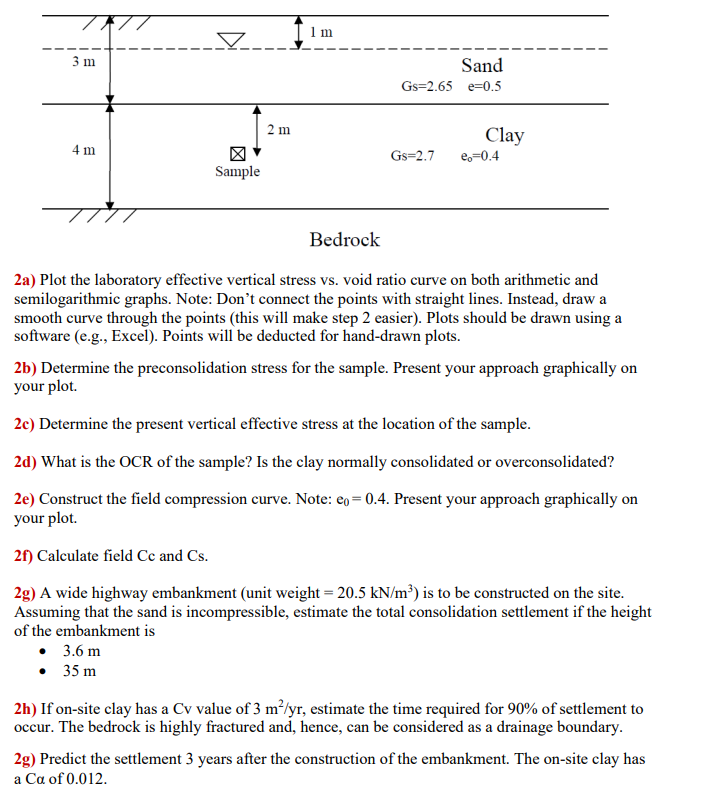
a Plot the laboratory effective vertical stress vs void ratio curve on both arithmetic and semilogarithmic graphs. Note: Don't connect the points with straight lines. Instead, draw a smooth curve through the points this will make step easier Plots should be drawn using a software eg Excel Points will be deducted for handdrawn plots.
b Determine the preconsolidation stress for the sample. Present your approach graphically on your plot.
c Determine the present vertical effective stress at the location of the sample.
d What is the OCR of the sample? Is the clay normally consolidated or overconsolidated?
e Construct the field compression curve. Note: mathrme Present your approach graphically on your plot.
f Calculate field Cc and Cs
g A wide highway embankment unit weight mathrmkNmathrmm is to be constructed on the site. Assuming that the sand is incompressible, estimate the total consolidation settlement if the height of the embankment is
m
m
h If onsite clay has a Cv value of mathrm~mmathrmyr estimate the time required for of settlement to occur. The bedrock is highly fractured and, hence, can be considered as a drainage boundary.
g Predict the settlement years after the construction of the embankment. The onsite clay has a C alpha of
Step by Step Solution
There are 3 Steps involved in it
1 Expert Approved Answer
Step: 1 Unlock

Question Has Been Solved by an Expert!
Get step-by-step solutions from verified subject matter experts
Step: 2 Unlock
Step: 3 Unlock