

Question: BEET2423 QUESTION 2 MATLAB Script Q2 is intended to plot three signals on separate figures. However, the script contains a few errors. Run and correct
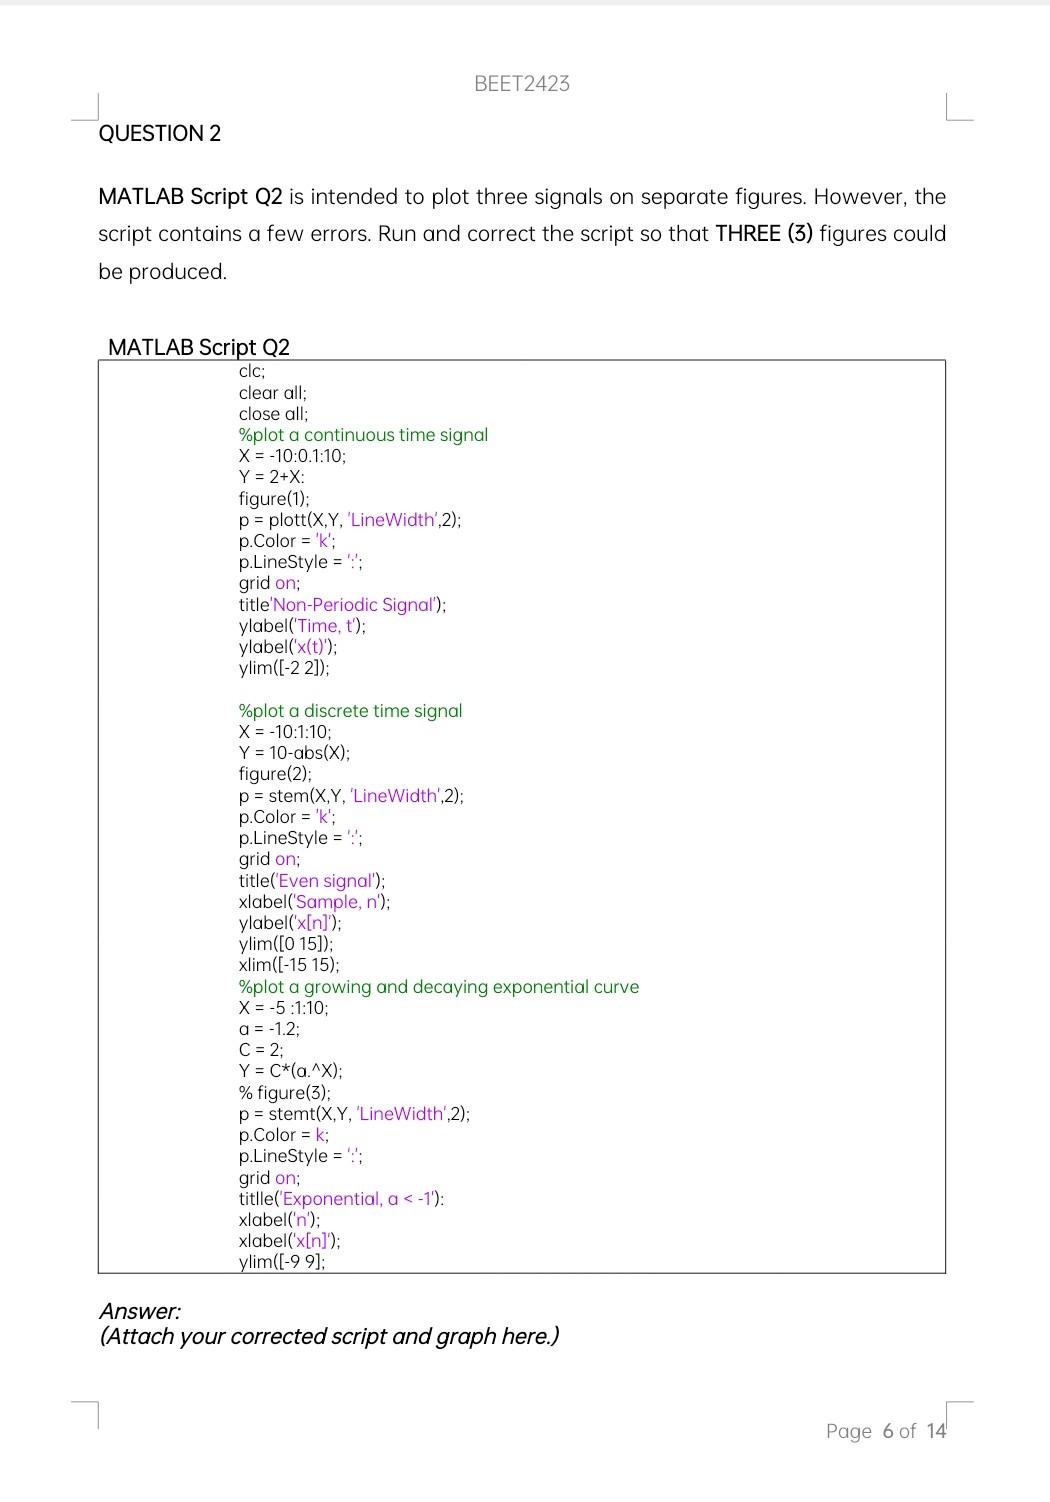
BEET2423 QUESTION 2 MATLAB Script Q2 is intended to plot three signals on separate figures. However, the script contains a few errors. Run and correct the script so that THREE (3) figures could be produced. MATLAB Script Q2 clc: clear all; close all; %plot a continuous time signal X = -10:0.1:10; Y = 2+X: figure(1); p = plott(X,Y, 'LineWidth',2); p.Color = 'k'; p.LineStyle=; grid on; title'Non-Periodic Signal'); ylabel('Time, t'); ylabel('X(t)'); ylim([-2 2]); %plot a discrete time signal X = -10:1:10; Y = 10-abs(X); figure(2); p = stem(X,Y, LineWidth',2); p.Color = 'k'; p.Line Style = 1; grid on; title('Even signal'); xlabel('Sample, n'); ylabel('x[n]); ylim([O 15]); xlim((-15 15); %plot a growing and decaying exponential curve X = -5:1:10; a = -1.2; C = 2; Y = C*(a.X); % figure(3); p = stemt(X,Y, 'LineWidth2); p.Color = k; p.LineStyle=; grid on; titlle('Exponential, a
Step by Step Solution
There are 3 Steps involved in it

Get step-by-step solutions from verified subject matter experts