

Question: Before After N Valid 8 8 Missing 6 6 Frequency Table Before Cumulative Frequency Percent Valid Percent Percent Valid 3.00 1 7.1 12.5 12.5 4.00
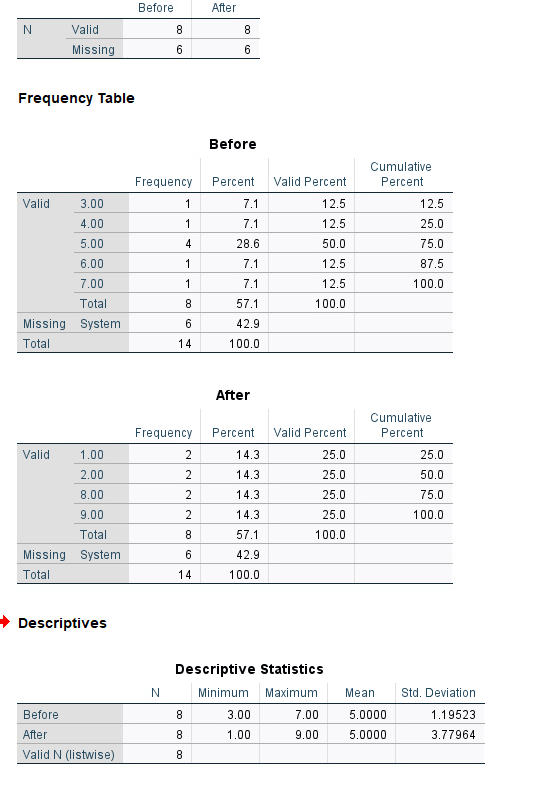
Before After N Valid 8 8 Missing 6 6 Frequency Table Before Cumulative Frequency Percent Valid Percent Percent Valid 3.00 1 7.1 12.5 12.5 4.00 7.1 12.5 25.0 5.00 28.6 50.0 75.0 6.00 7.1 12.5 87.5 7.00 7.1 12.5 100.0 Total 8 57.1 100.0 Missing System 6 42.9 Total 14 100.0 After Cumulative Frequency Percent Valid Percent Percent Valid 1.00 2 14.3 25.0 25.0 2.00 IN 14.3 25.0 50.0 8.00 14.3 25.0 75.0 9.00 2 14.3 25.0 100.0 Total 8 57.1 100.0 Missing System 6 42.9 Total 14 100.0 Descriptives Descriptive Statistics N Minimum Maximum Mean Std. Deviation Before 8 3.00 7.00 5.0000 1.19523 After 8 1.00 9.00 5.0000 3.77964 Valid N (listwise) 8A high school English teacher measured the attitudes of 11th-grade students toward poetry. After a 9-week unit on poetry, she measured the students' attitudes again. She was disappointed to find that the mean change was zero
Step by Step Solution
There are 3 Steps involved in it

Get step-by-step solutions from verified subject matter experts