

Question: Before any detailed analysis task is performed and statistical model is fit to data, the input data is preprocessed and cleaned during the exploration phase
Before any detailed analysis task is performed and statistical model is fit to data, the input data is preprocessed and cleaned during the exploration phase of the analysis process. This phase is commonly known as exploratory data analysis (EDA), and it includes?data cleaning, such as treating missing values and detecting outliers, and?transformations,?such as data type conversions, functional transformation, normalization, and scaling. Please identify one data cleaning activity and one transformation activity and discuss when and how you would perform such activities. In addition, summarize major issues in data analysis, evaluate the requirements and techniques for each activity, and differentiate between supervised and unsupervised learning. Provide examples as necessary to support your argument
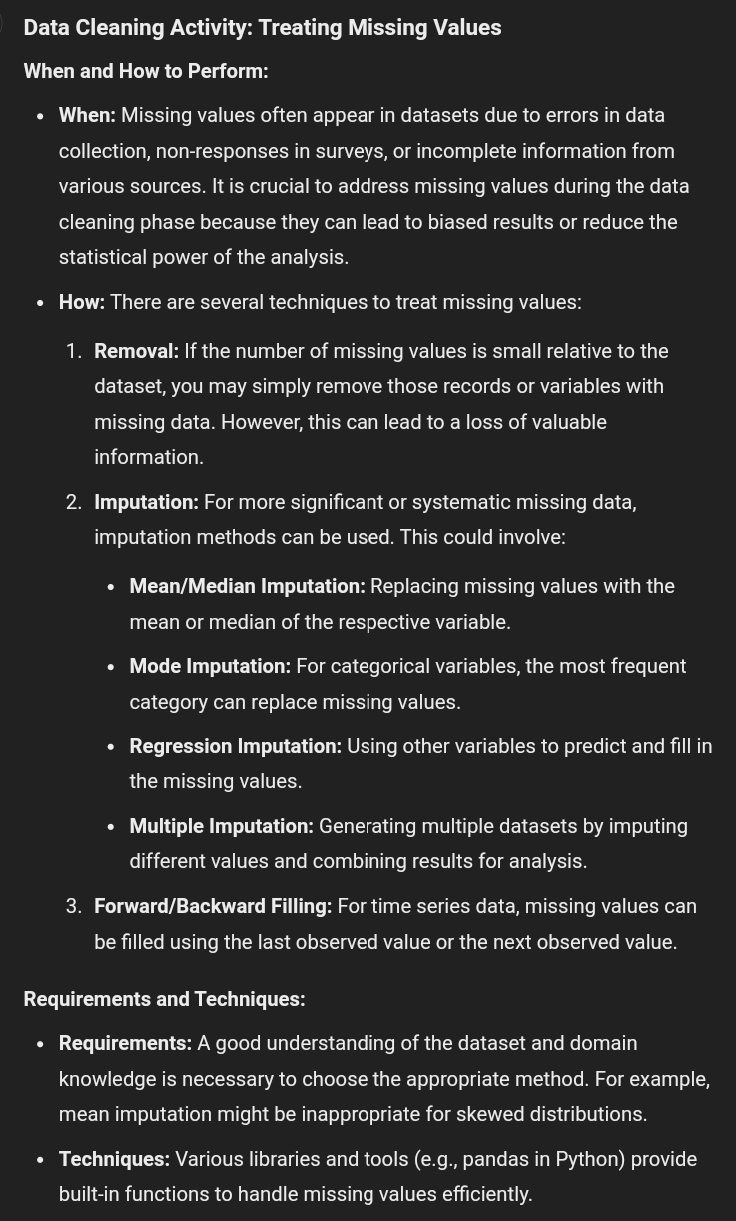
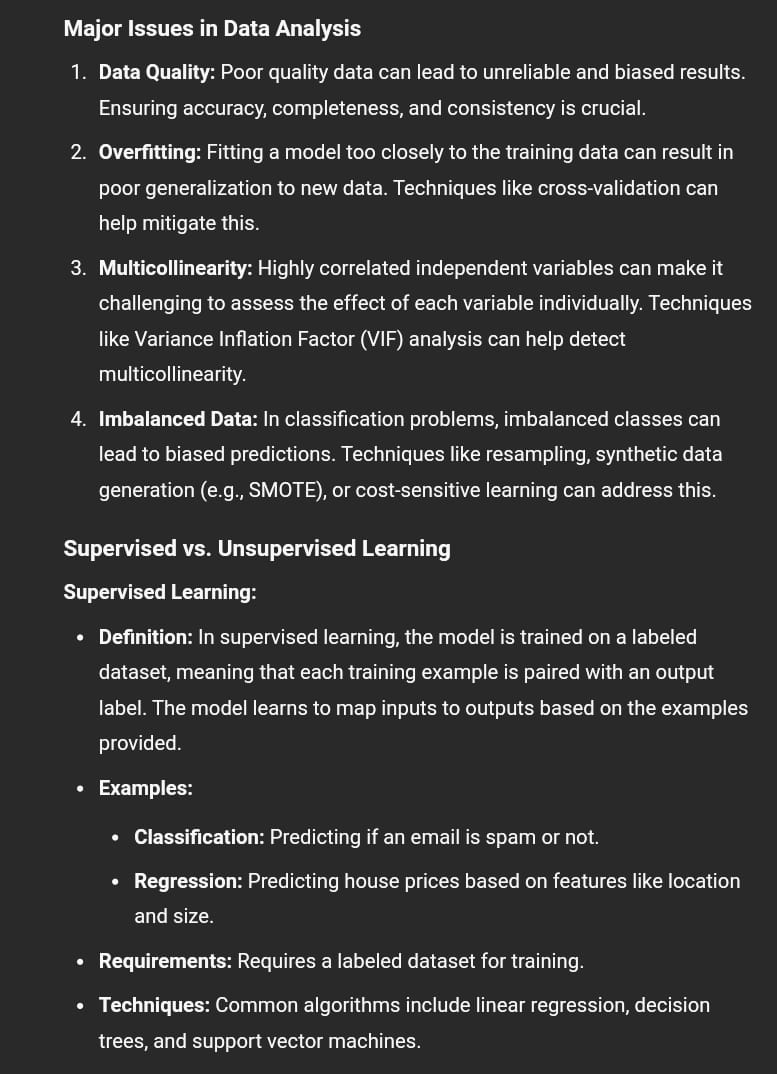
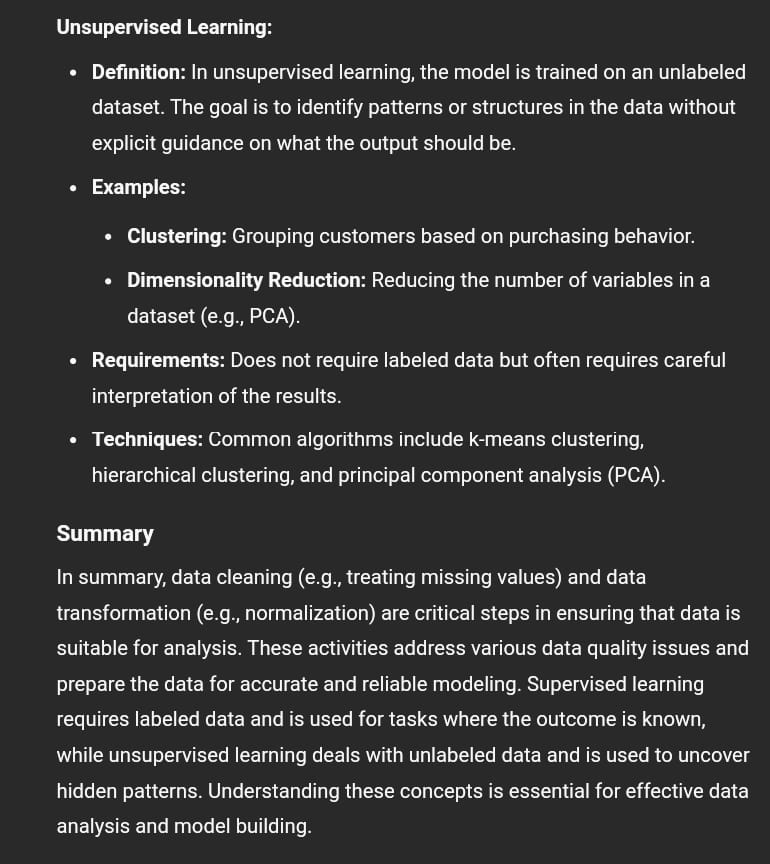
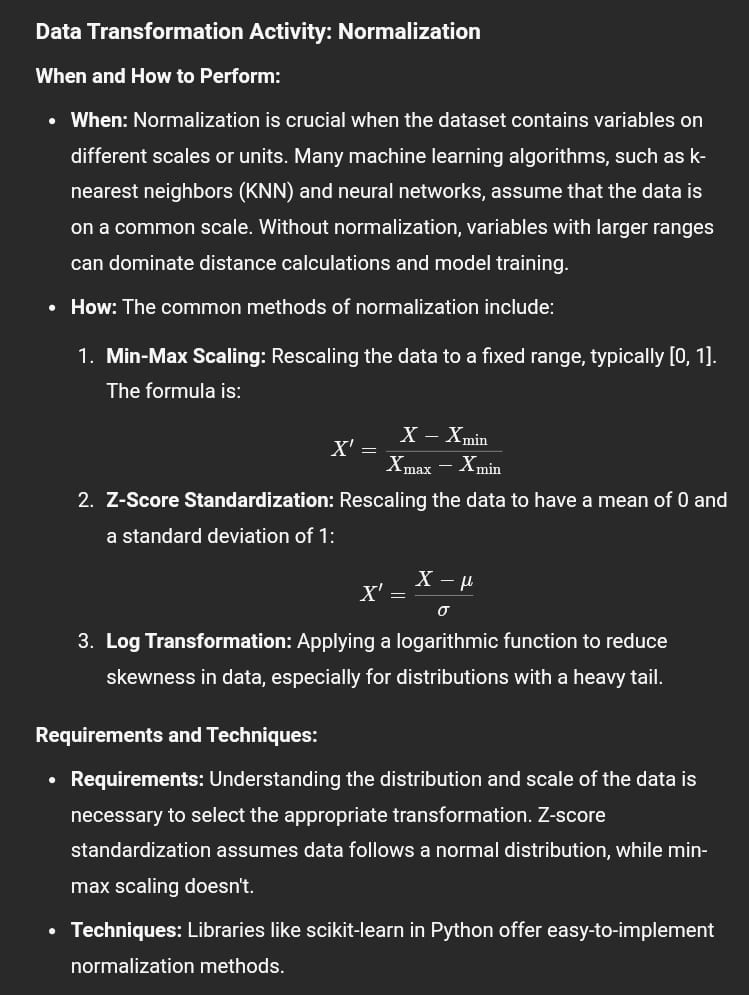 Data Cleaning Activity: Treating Missing Values When and How to Perform: When: Missing values often appear in datasets due to errors in data collection, non-responses in surveys, or incomplete information from various sources. It is crucial to address missing values during the data cleaning phase because they can lead to biased results or reduce the statistical power of the analysis. How: There are several techniques to treat missing values: 1. Removal: If the number of missing values is small relative to the dataset, you may simply remove those records or variables with missing data. However, this can lead to a loss of valuable information. . Imputation: For more significant or systematic missing data, imputation methods can be used. This could involve: Mean/Median Imputation: Replacing missing values with the mean or median of the respective variable. Mode Imputation: For categorical variables, the most frequent category can replace missing values. Regression Imputation: Using other variables to predict and fill in the missing values. Multiple Imputation: Generating multiple datasets by imputing different values and combining results for analysis. 3. Forward/Backward Filling: For time series data, missing values can be filled using the last observed value or the next observed value. Requirements and Techniques: Requirements: A good understanding of the dataset and domain knowledge is necessary to choose the appropriate method. For example, mean imputation might be inappropriate for skewed distributions. Techniques: Various libraries and tools (e.g., pandas in Python) provide built-in functions to handle missing values efficiently. Major Issues in Data Analysis 1 Data Quality: Poor quality data can lead to unreliable and biased results. Ensuring accuracy, completeness, and consistency is crucial. . Overfitting: Fitting a model too closely to the training data can result in poor generalization to new data. Techniques like cross-validation can help mitigate this. . Multicollinearity: Highly correlated independent variables can make it challenging to assess the effect of each variable individually. Techniques like Variance Inflation Factor (VIF) analysis can help detect multicollinearity. . Imbalanced Data: In classification problems, imbalanced classes can lead to biased predictions. Techniques like resampling, synthetic data generation (e.g., SMOTE), or cost-sensitive learning can address this. Supervised vs. Unsupervised Learning Supervised Learning: Definition: In supervised learning, the model is trained on a labeled dataset, meaning that each training example is paired with an output label. The model learns to map inputs to outputs based on the examples provided. Examples: Classification: Predicting if an email is spam or not. Regression: Predicting house prices based on features like location and size. Requirements: Requires a labeled dataset for training. Techniques: Common algorithms include linear regression, decision trees, and support vector machines. Unsupervised Learning: Definition: In unsupervised learning, the model is trained on an unlabeled dataset. The goal is to identify patterns or structures in the data without explicit guidance on what the output should be. Examples: Clustering: Grouping customers based on purchasing behavior. Dimensionality Reduction: Reducing the number of variables in a dataset (e.g., PCA). Requirements: Does not require labeled data but often requires careful interpretation of the results. Techniques: Common algorithms include k-means clustering, hierarchical clustering, and principal component analysis (PCA). Summary In summary, data cleaning (e.g., treating missing values) and data transformation (e.g., normalization) are critical steps in ensuring that data is suitable for analysis. These activities address various data quality issues and prepare the data for accurate and reliable modeling. Supervised learning requires labeled data and is used for tasks where the outcome is known, while unsupervised learning deals with unlabeled data and is used to uncover hidden patterns. Understanding these concepts is essential for effective data analysis and model building. Data Transformation Activity: Normalization When and How to Perform: When: Normalization is crucial when the dataset contains variables on different scales or units. Many machine learning algorithms, such as k- nearest neighbors (KNN) and neural networks, assume that the data is on a common scale. Without normalization, variables with larger ranges can dominate distance calculations and model training. How: The common methods of normalization include: 1. Min-Max Scaling: Rescaling the data to a fixed range, typically [0, 1]. The formula is: X_Xmin P 2. Z-Score Standardization: Rescaling the data to have a mean of 0 and = a standard deviation of 1: X p o 3. Log Transformation: Applying a logarithmic function to reduce b= skewness in data, especially for distributions with a heavy tail. Requirements and Techniques: Requirements: Understanding the distribution and scale of the data is necessary to select the appropriate transformation. Z-score standardization assumes data follows a normal distribution, while min- max scaling doesn't. Techniques: Libraries like scikit-learn in Python offer easy-to-implement normalization methods
 Step by Step Solution
There are 3 Steps involved in it

Get step-by-step solutions from verified subject matter experts