

Question: Before AUSING LTD approaches the bank for a loan the company has asked their internal credit department to see if the firm can generate any
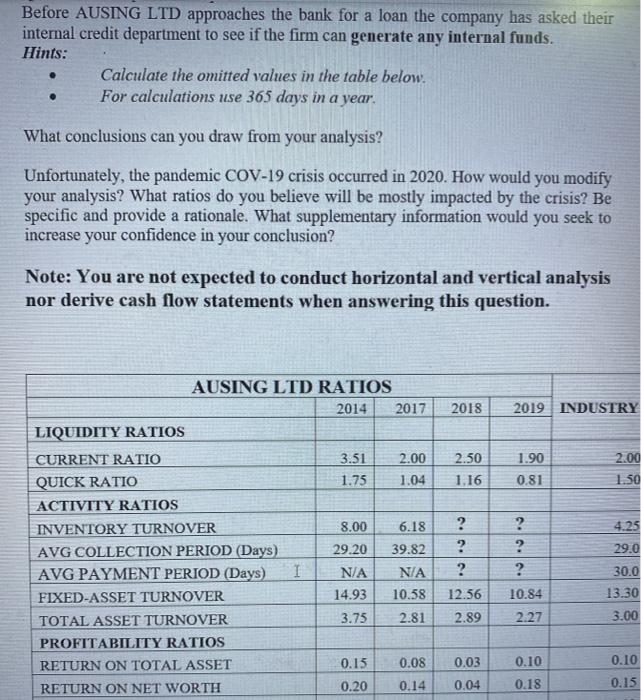
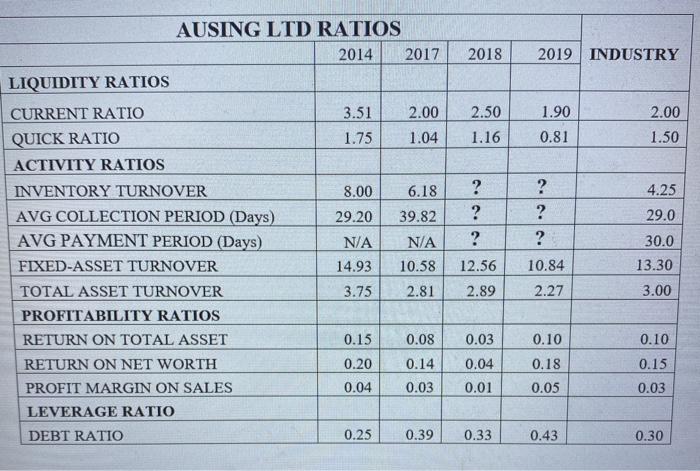
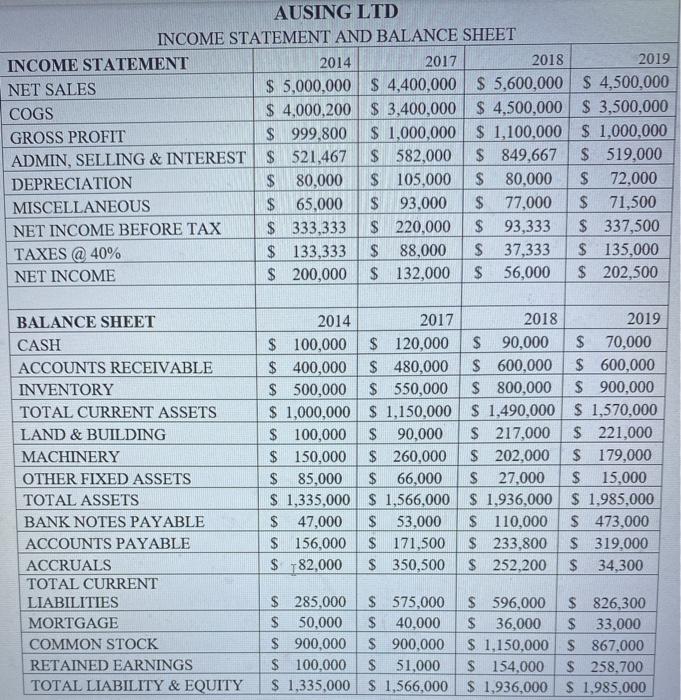
Before AUSING LTD approaches the bank for a loan the company has asked their internal credit department to see if the firm can generate any internal funds. Hints: Calculate the omitted values in the table below. For calculations use 365 days in a year. What conclusions can you draw from your analysis? Unfortunately, the pandemic COV-19 crisis occurred in 2020. How would you modify your analysis? What ratios do you believe will be mostly impacted by the crisis? Be specific and provide a rationale. What supplementary information would you seek to increase your confidence in your conclusion? Note: You are not expected to conduct horizontal and vertical analysis nor derive cash flow statements when answering this question. AUSING LTD RATIOS 2014 2017 LIQUIDITY RATIOS 2018 2019 INDUSTRY 3.51 1.75 2.00 1.04 2.50 1.16 1.90 0.81 2.00 1.50 6.18 4.25 8.00 29.20 CURRENT RATIO QUICK RATIO ACTIVITY RATIOS INVENTORY TURNOVER AVG COLLECTION PERIOD (Days) AVG PAYMENT PERIOD (Days) FIXED-ASSET TURNOVER TOTAL ASSET TURNOVER PROFITABILITY RATIOS RETURN ON TOTAL ASSET RETURN ON NET WORTH ... ? ? ? 29.0 I N/A 14.93 39.82 10.58 2.81 12.56 10.84 30.0 13.30 3.00 3.75 2.89 2.27 0.08 0.10 0.15 0.20 0.03 0.04 0.10 0.18 0.14 0.15 2018 2019 INDUSTRY 2.00 2.50 1.16 1.90 0.81 1.50 AUSING LTD RATIOS 2014 2017 LIQUIDITY RATIOS CURRENT RATIO 3.51 2.00 QUICK RATIO 1.75 1.04 ACTIVITY RATIOS INVENTORY TURNOVER 8.00 6.18 AVG COLLECTION PERIOD (Days) 29.20 39.82 AVG PAYMENT PERIOD (Days) N/A N/A FIXED-ASSET TURNOVER 14.93 10.58 TOTAL ASSET TURNOVER 3.75 2.81 PROFITABILITY RATIOS RETURN ON TOTAL ASSET 0.15 0.08 RETURN ON NET WORTH 0.20 0.14 PROFIT MARGIN ON SALES 0.04 0.03 LEVERAGE RATIO DEBT RATIO 0.25 0.39 ? ? ? ? ? ? 4.25 29.0 30.0 13.30 12.56 2.89 10.84 2.27 3.00 0.03 0.10 0.10 0.04 0.18 0.15 0.03 0.01 0.05 0.33 0.43 0.30 AUSING LTD INCOME STATEMENT AND BALANCE SHEET INCOME STATEMENT 2014 2017 2018 2019 NET SALES $ 5,000,000 $4,400,000 $ 5,600,000 $ 4,500,000 COGS $ 4,000,200 $ 3,400,000 $ 4,500,000 $ 3,500,000 GROSS PROFIT $ 999,800 $ 1,000,000 $ 1,100,000 $ 1,000,000 ADMIN, SELLING & INTEREST $ 521,467 $ 582,000 $ 849,667 $ 519,000 DEPRECIATION $ 80,000 $ 105,000 $ 80,000 $72,000 MISCELLANEOUS $ 65,000 $ 93,000 $ 77,000 $ 71,500 NET INCOME BEFORE TAX $ 333,333 $ 220,000 $ 93,333 $ 337,500 TAXES @ 40% $ 133,333 $ 88,000 $ 37,333 $ 135,000 NET INCOME $ 200,000 $ 132,000 $ 56,000 $ 202,500 BALANCE SHEET CASH ACCOUNTS RECEIVABLE INVENTORY TOTAL CURRENT ASSETS LAND & BUILDING MACHINERY OTHER FIXED ASSETS TOTAL ASSETS BANK NOTES PAYABLE ACCOUNTS PAYABLE ACCRUALS TOTAL CURRENT LIABILITIES MORTGAGE COMMON STOCK RETAINED EARNINGS TOTAL LIABILITY & EQUITY 2014 2017 2018 2019 $ 100,000 $ 120,000 $ 90,000 $ 70,000 $ 400,000 $ 480,000 $ 600,000 $ 600,000 $ 500,000 $ 550,000 $ 800,000 $ 900,000 $ 1,000,000 $ 1,150,000 $ 1,490,000 $ 1,570,000 $ 100,000 $ 90,000 $ 217,000 $ 221,000 $ 150,000 $ 260,000 $ 202,000 $ 179,000 $ 85,000 $ 66,000 $ 27,000 $ 15,000 $ 1,335,000 $ 1,566,000 $ 1,936,000 $ 1,985,000 $ 47,000 $ 53,000 $ 110,000 $ 473,000 $ 156,000 $ 171,500 $ 233,800 $ 319,000 $ 782,000 $ 350,500 $ 252,200 $ 34,300 $285,000 $ 575,000 $ 596,000 $ 826,300 $ 50,000 $ 40,000 $ 36,000 $ 33,000 $ 900,000 $ 900,000 $ 1,150,000 $ 867,000 $ 100,000 S 51,000 $ 154,000 $ 258.700 $ 1,335,000 $ 1,566,000 $1,936.000 $ 1,985.000 Before AUSING LTD approaches the bank for a loan the company has asked their internal credit department to see if the firm can generate any internal funds. Hints: Calculate the omitted values in the table below. For calculations use 365 days in a year. What conclusions can you draw from your analysis? Unfortunately, the pandemic COV-19 crisis occurred in 2020. How would you modify your analysis? What ratios do you believe will be mostly impacted by the crisis? Be specific and provide a rationale. What supplementary information would you seek to increase your confidence in your conclusion? Note: You are not expected to conduct horizontal and vertical analysis nor derive cash flow statements when answering this question. AUSING LTD RATIOS 2014 2017 LIQUIDITY RATIOS 2018 2019 INDUSTRY 3.51 1.75 2.00 1.04 2.50 1.16 1.90 0.81 2.00 1.50 6.18 4.25 8.00 29.20 CURRENT RATIO QUICK RATIO ACTIVITY RATIOS INVENTORY TURNOVER AVG COLLECTION PERIOD (Days) AVG PAYMENT PERIOD (Days) FIXED-ASSET TURNOVER TOTAL ASSET TURNOVER PROFITABILITY RATIOS RETURN ON TOTAL ASSET RETURN ON NET WORTH ... ? ? ? 29.0 I N/A 14.93 39.82 10.58 2.81 12.56 10.84 30.0 13.30 3.00 3.75 2.89 2.27 0.08 0.10 0.15 0.20 0.03 0.04 0.10 0.18 0.14 0.15 2018 2019 INDUSTRY 2.00 2.50 1.16 1.90 0.81 1.50 AUSING LTD RATIOS 2014 2017 LIQUIDITY RATIOS CURRENT RATIO 3.51 2.00 QUICK RATIO 1.75 1.04 ACTIVITY RATIOS INVENTORY TURNOVER 8.00 6.18 AVG COLLECTION PERIOD (Days) 29.20 39.82 AVG PAYMENT PERIOD (Days) N/A N/A FIXED-ASSET TURNOVER 14.93 10.58 TOTAL ASSET TURNOVER 3.75 2.81 PROFITABILITY RATIOS RETURN ON TOTAL ASSET 0.15 0.08 RETURN ON NET WORTH 0.20 0.14 PROFIT MARGIN ON SALES 0.04 0.03 LEVERAGE RATIO DEBT RATIO 0.25 0.39 ? ? ? ? ? ? 4.25 29.0 30.0 13.30 12.56 2.89 10.84 2.27 3.00 0.03 0.10 0.10 0.04 0.18 0.15 0.03 0.01 0.05 0.33 0.43 0.30 AUSING LTD INCOME STATEMENT AND BALANCE SHEET INCOME STATEMENT 2014 2017 2018 2019 NET SALES $ 5,000,000 $4,400,000 $ 5,600,000 $ 4,500,000 COGS $ 4,000,200 $ 3,400,000 $ 4,500,000 $ 3,500,000 GROSS PROFIT $ 999,800 $ 1,000,000 $ 1,100,000 $ 1,000,000 ADMIN, SELLING & INTEREST $ 521,467 $ 582,000 $ 849,667 $ 519,000 DEPRECIATION $ 80,000 $ 105,000 $ 80,000 $72,000 MISCELLANEOUS $ 65,000 $ 93,000 $ 77,000 $ 71,500 NET INCOME BEFORE TAX $ 333,333 $ 220,000 $ 93,333 $ 337,500 TAXES @ 40% $ 133,333 $ 88,000 $ 37,333 $ 135,000 NET INCOME $ 200,000 $ 132,000 $ 56,000 $ 202,500 BALANCE SHEET CASH ACCOUNTS RECEIVABLE INVENTORY TOTAL CURRENT ASSETS LAND & BUILDING MACHINERY OTHER FIXED ASSETS TOTAL ASSETS BANK NOTES PAYABLE ACCOUNTS PAYABLE ACCRUALS TOTAL CURRENT LIABILITIES MORTGAGE COMMON STOCK RETAINED EARNINGS TOTAL LIABILITY & EQUITY 2014 2017 2018 2019 $ 100,000 $ 120,000 $ 90,000 $ 70,000 $ 400,000 $ 480,000 $ 600,000 $ 600,000 $ 500,000 $ 550,000 $ 800,000 $ 900,000 $ 1,000,000 $ 1,150,000 $ 1,490,000 $ 1,570,000 $ 100,000 $ 90,000 $ 217,000 $ 221,000 $ 150,000 $ 260,000 $ 202,000 $ 179,000 $ 85,000 $ 66,000 $ 27,000 $ 15,000 $ 1,335,000 $ 1,566,000 $ 1,936,000 $ 1,985,000 $ 47,000 $ 53,000 $ 110,000 $ 473,000 $ 156,000 $ 171,500 $ 233,800 $ 319,000 $ 782,000 $ 350,500 $ 252,200 $ 34,300 $285,000 $ 575,000 $ 596,000 $ 826,300 $ 50,000 $ 40,000 $ 36,000 $ 33,000 $ 900,000 $ 900,000 $ 1,150,000 $ 867,000 $ 100,000 S 51,000 $ 154,000 $ 258.700 $ 1,335,000 $ 1,566,000 $1,936.000 $ 1,985.000
Step by Step Solution
There are 3 Steps involved in it

Get step-by-step solutions from verified subject matter experts