

Question: Before you make a scatterplot or perform any calculations, what kind of association do you expect between the two variables? Explain why this is your
Before you make a scatterplot or perform any calculations, what kind of association do you expect between the two variables? Explain why this is your expectation.
Which variable is the explanatory variable, and which is the response variable?
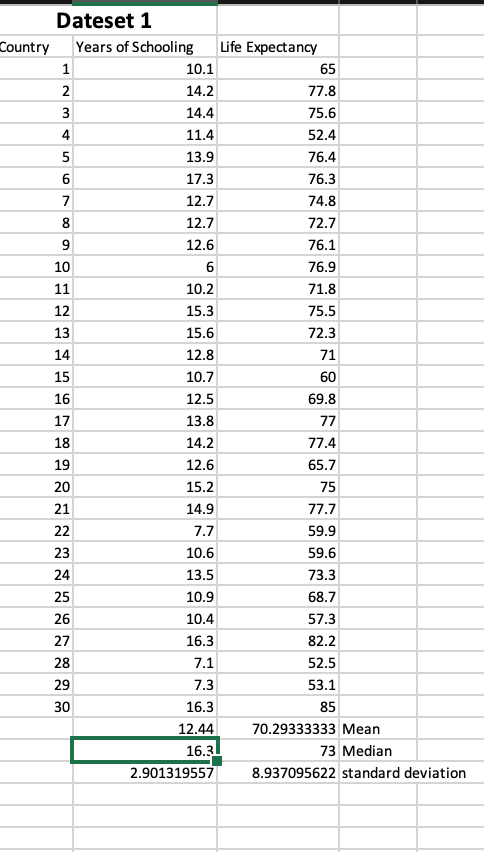
Dateset 1 Country Years of Schooling Life Expectancy 10.1 65 14.2 77.8 14.4 75.6 11.4 52.4 13.9 76.4 17.3 76.3 12.7 74.8 8 12.7 72.7 LO 12.6 76.1 10 6 76.9 11 10.2 71.8 12 15.3 75.5 13 15.6 72.3 14 12.8 71 15 10.7 60 16 12.5 69.8 17 13.8 77 18 14.2 77.4 19 12.6 65.7 20 15.2 75 21 14.9 77.7 22 7.7 59.9 23 10.6 59.6 24 13.5 73.3 25 10.9 68.7 26 10.4 57.3 27 16.3 82.2 28 7.1 52.5 29 7.3 53.1 30 16.3 85 12.44 70.29333333 Mean 16.3 73 Median 2.901319557 8.937095622 standard deviation
Step by Step Solution
There are 3 Steps involved in it

Get step-by-step solutions from verified subject matter experts