

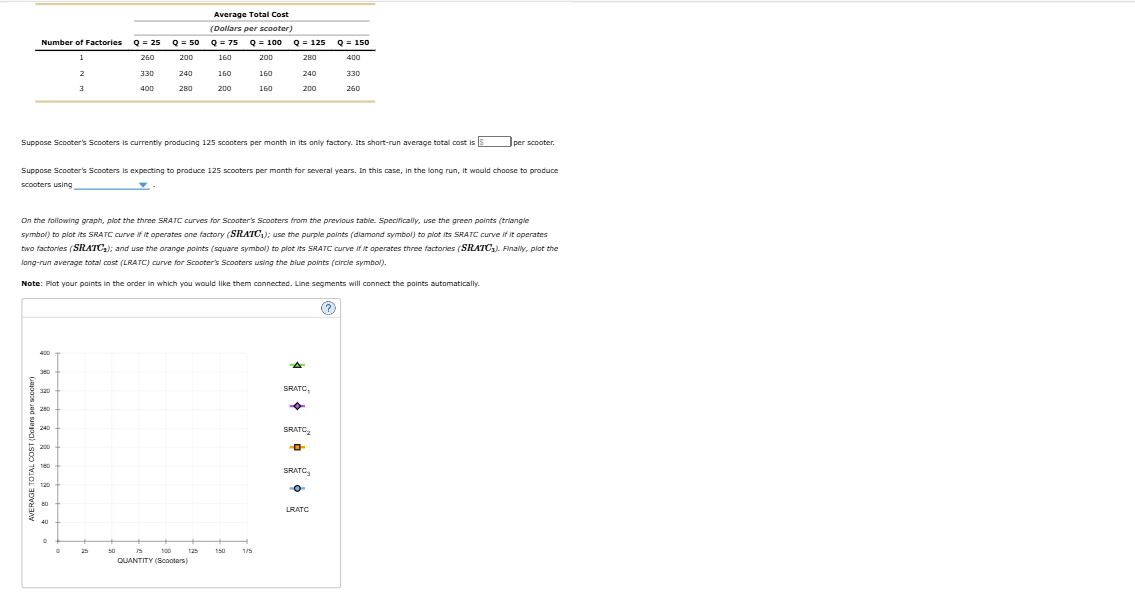
Question: begin { tabular } { ccccccc } hline & multicolumn { 5 } { c } { Average Total Cost }
begintabularccccccc
hline & multicolumnc Average Total Cost
cline Number of Factories & mathbfQ & mathbfQ & mathbfQ & mathbfQ & mathbfQ & mathbfQ
hline & & & & & &
& & & & & &
& & & & & &
hline
endtabular
Suppase Scooter's Scooters is currently producing scoaters per month in its anly factory. Its shortrun average total cost is
per scooter
Suppose Scooter's Scooters is expecting to produce scooters per month for several years. In this case, in the long run, it would choose to produce scooters using
On the following graph, plot the three SRATC curves for Scooter's Scooters from the previous table. Speclfically, use the green points trilangle symbol to plot its SRATC curve if it operates ane factory SRATC I ; use the purple points diamand symbol to plot its SRATC curve if it operates Jangrun average total cost LRATC curve for Scooter's Scooters using the biue points circle symbol
Note: Plot your points in the order in which you would like them connected. Line segments will connect the paints automatically.
Step by Step Solution
There are 3 Steps involved in it
1 Expert Approved Answer
Step: 1 Unlock

Question Has Been Solved by an Expert!
Get step-by-step solutions from verified subject matter experts
Step: 2 Unlock
Step: 3 Unlock