

Question: begin{tabular}{cccc} hline Period & ActualDemand & ForecastModel1 & ForecastModel2 hline 8 & 255 & 372 & 493 9 & 340 & 284 &
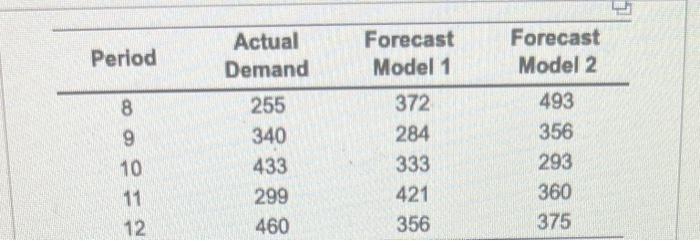
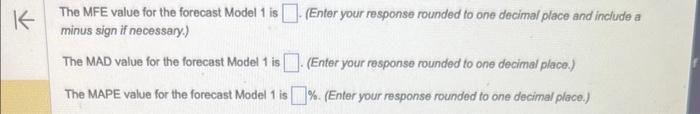
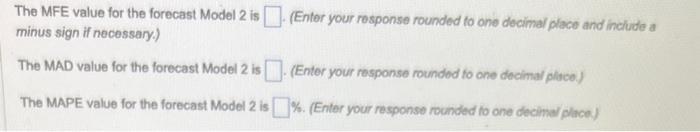
\begin{tabular}{cccc} \hline Period & ActualDemand & ForecastModel1 & ForecastModel2 \\ \hline 8 & 255 & 372 & 493 \\ 9 & 340 & 284 & 356 \\ 10 & 433 & 333 & 293 \\ 11 & 299 & 421 & 360 \\ 12 & 460 & 356 & 375 \\ \hline \end{tabular} The MFE value for the forecast Model 1 is (Enter your response rounded to one decimal place and include a minus sign if necessary.) The MAD value for the forecast Model 1 is (Enter your response rounded to one decimal place.) The MAPE value for the forecast Model 1 is %. (Enter your response rounded to one decimal place.) The MFE value for the forecast Model 2 is minus sign if necessary.) (Enter your response rounded to one decimal place and inciude a The MAD value for the forecast Model 2 is (Enter your response rounded to one decima/ plice) The MAPE value for the forecast Model 2 is \%. (Enter your response rounded to one decina/ plice)
Step by Step Solution
There are 3 Steps involved in it

Get step-by-step solutions from verified subject matter experts