

Question: ? begin{tabular}{cc|cc} hline SampleSize,n & MeanFactor,A2 & UpperRange,D4 & LowerRange,D3 hline 2 & 1.880 & 3.268 & 0 3 & 1.023 & 2.574
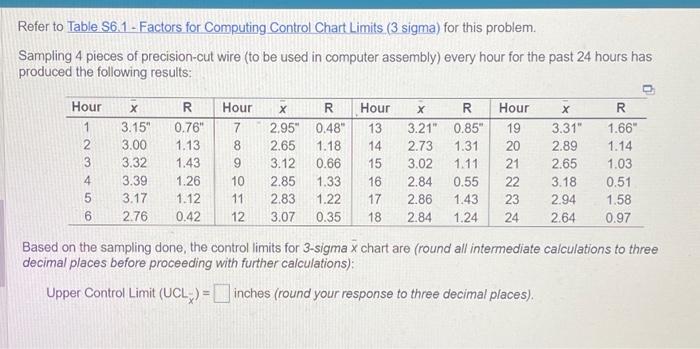
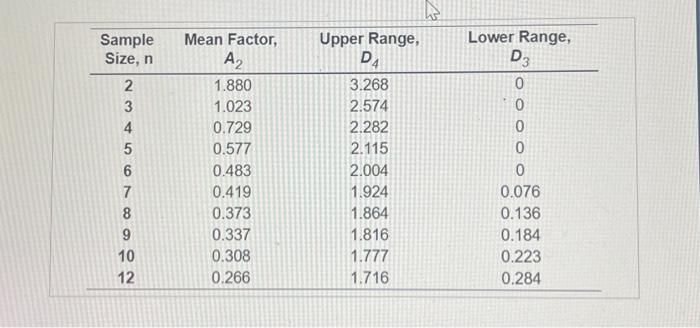
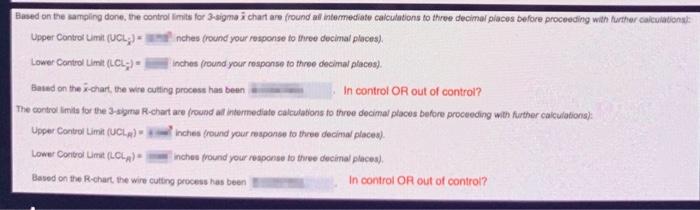
\begin{tabular}{cc|cc} \hline SampleSize,n & MeanFactor,A2 & UpperRange,D4 & LowerRange,D3 \\ \hline 2 & 1.880 & 3.268 & 0 \\ 3 & 1.023 & 2.574 & 0 \\ 4 & 0.729 & 2.282 & 0 \\ 5 & 0.577 & 2.115 & 0 \\ 6 & 0.483 & 2.004 & 0 \\ 7 & 0.419 & 1.924 & 0.076 \\ 8 & 0.373 & 1.864 & 0.136 \\ 9 & 0.337 & 1.816 & 0.184 \\ 10 & 0.308 & 1.777 & 0.223 \\ 12 & 0.266 & 1.716 & 0.284 \\ \hline \end{tabular} Refer to Table S6.1-Factors for Computing Control Chart Limits (3 sigma) for this problem. Sampling 4 pieces of precision-cut wire (to be used in computer assembly) every hour for the past 24 hours has produced the following results: Based on the sampling done, the control limits for 3-sigma x chart are (round all intermediate calculations to three decimal places before proceeding with further calculations): Upper Control Limit (UCL~)= inches (round your response to three decimal places). nches (round your response to three decinal places). Lower Cantrol Umit (LC)= inches (round your rosponse to three decimal places). Baisd on the x-chart, the wire culting process has been In control OR out of control? The cortrol imits for the 3-signe R-chart are (round af intermediate calculations to throe decimal places before proceeding with further caiculations): Lower Cocityol Umit (CCL)* Inches fround your response to three decinal places). Based on the R-chart the wire cutting process has been. In control OA out of control
Step by Step Solution
There are 3 Steps involved in it

Get step-by-step solutions from verified subject matter experts