

Question: begin{tabular}{|c|c|c|c|} hline V1 & V2 & V3 & Class hline T & T & 1.0 & + hline F & T & 3.0
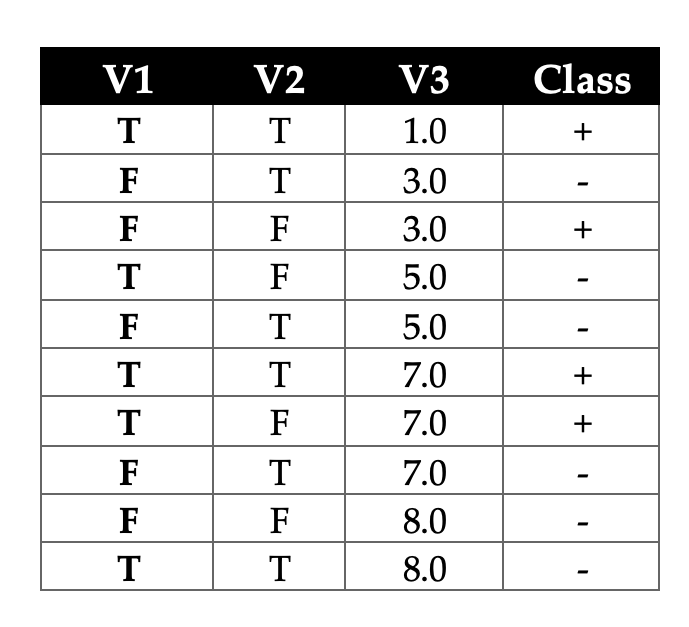
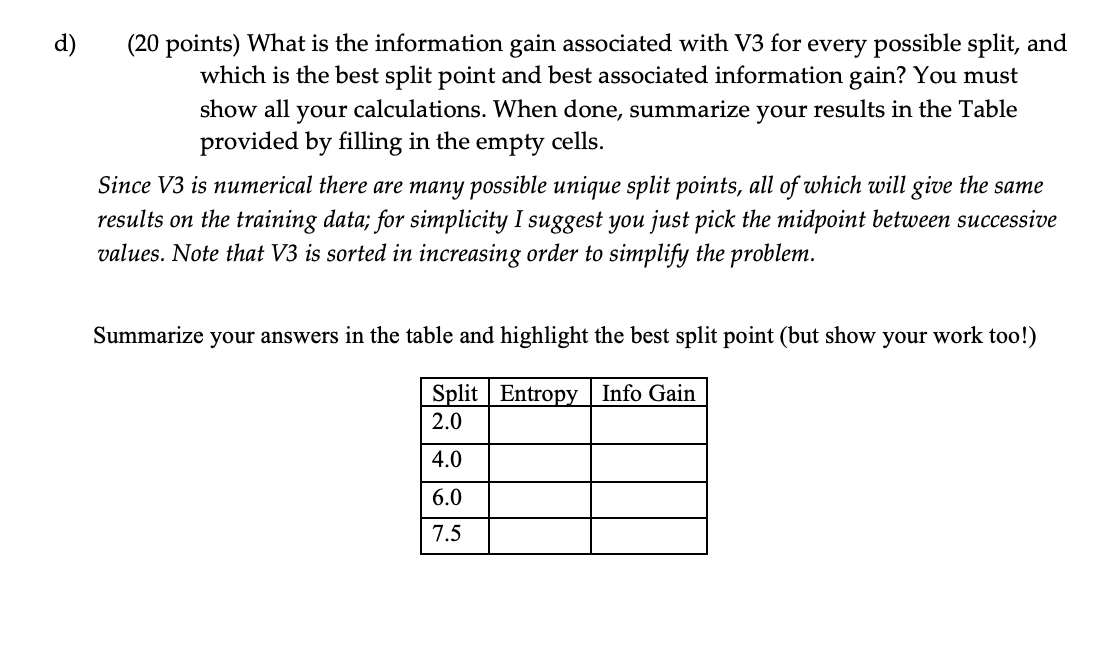
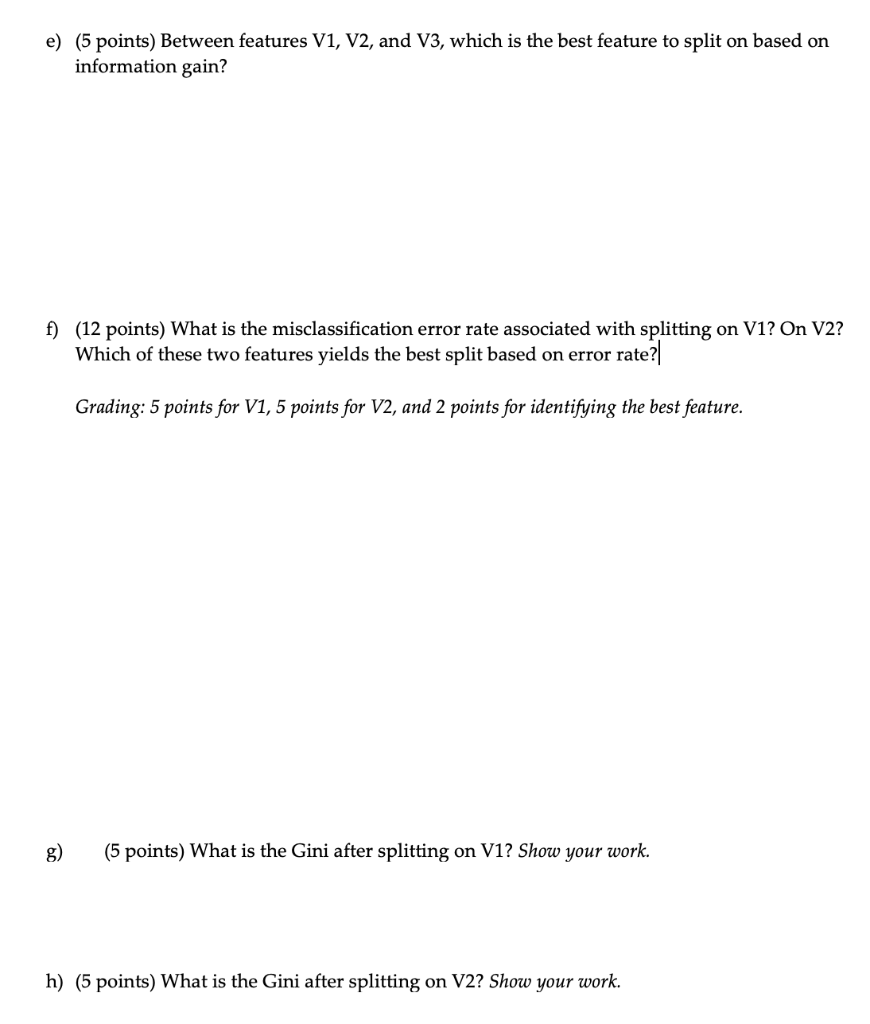
\begin{tabular}{|c|c|c|c|} \hline V1 & V2 & V3 & Class \\ \hline T & T & 1.0 & + \\ \hline F & T & 3.0 & \\ \hline F & F & 3.0 & + \\ \hline T & F & 5.0 & \\ \hline F & T & 5.0 & \\ \hline T & T & 7.0 & + \\ \hline T & F & 7.0 & + \\ \hline F & T & 7.0 & \\ \hline F & F & 8.0 & \\ \hline T & T & 8.0 & \\ \hline \end{tabular} 1) (20 points) What is the information gain associated with V3 for every possible split, and which is the best split point and best associated information gain? You must show all your calculations. When done, summarize your results in the Table provided by filling in the empty cells. Since V3 is numerical there are many possible unique split points, all of which will give the same results on the training data; for simplicity I suggest you just pick the midpoint between successive values. Note that V3 is sorted in increasing order to simplify the problem. Summarize your answers in the table and highlight the best split point (but show your work too!) e) (5 points) Between features V1, V2, and V3, which is the best feature to split on based on information gain? f) (12 points) What is the misclassification error rate associated with splitting on V1? On V2? Which of these two features yields the best split based on error rate? Grading: 5 points for V1, 5 points for V2, and 2 points for identifying the best feature. g) (5 points) What is the Gini after splitting on V1? Show your work. h) (5 points) What is the Gini after splitting on V2? Show your work
Step by Step Solution
There are 3 Steps involved in it

Get step-by-step solutions from verified subject matter experts