

Question: begin{tabular}{|c|c|c|c|c|} hline multicolumn{1}{|c|}{ A } & B & C & E hline Year & multicolumn{2}{|c|}{ Apples } & multicolumn{2}{c|}{ Bananas } hline 1
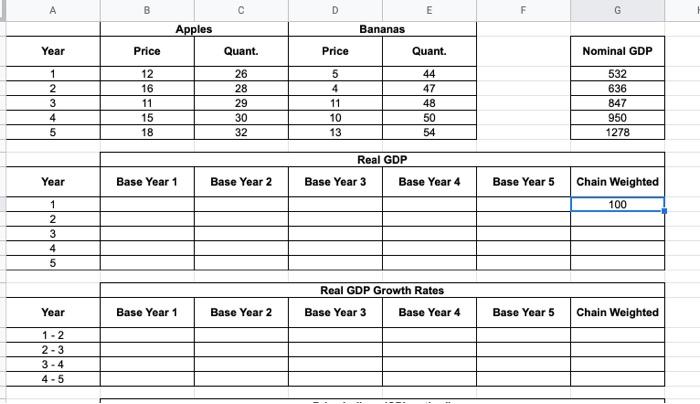
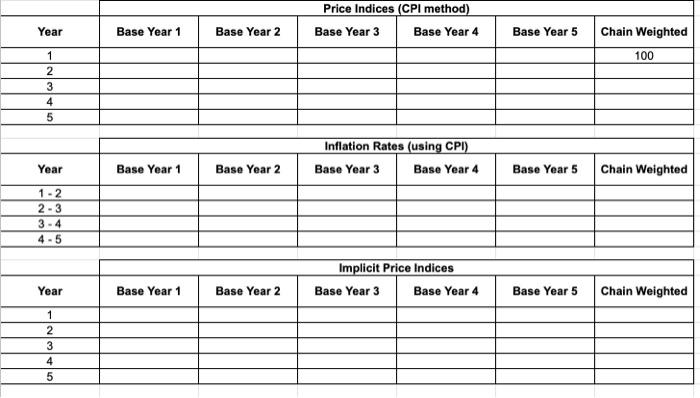
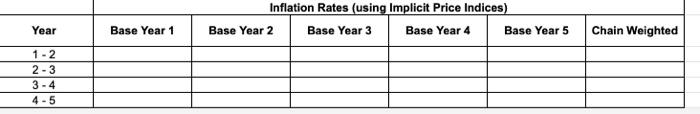
\begin{tabular}{|c|c|c|c|c|} \hline \multicolumn{1}{|c|}{ A } & B & C & E \\ \hline Year & \multicolumn{2}{|c|}{ Apples } & \multicolumn{2}{c|}{ Bananas } \\ \hline 1 & Price & Quant. & Price & Quant. \\ \hline 2 & 12 & 26 & 5 & 44 \\ \hline 3 & 16 & 28 & 4 & 47 \\ \hline 4 & 11 & 29 & 11 & 48 \\ \hline 5 & 15 & 30 & 10 & 50 \\ \hline \end{tabular} \begin{tabular}{|c|} \hline Nominal GDP \\ \hline 532 \\ \hline 636 \\ \hline 847 \\ \hline 950 \\ \hline 1278 \\ \hline \end{tabular} \begin{tabular}{|c|c|c|c|c|c|c|} \cline { 2 - 9 } & \multicolumn{6}{|c|}{ Year } \\ \hline \multirow{2}{*}{ Year } & Base Year 1 & Base Year 2 & Base Year 3 & Base Year 4 & Base Year 5 & Chain Weighted \\ \hline 1 & & & & & & 100 \\ \hline 2 & & & & & & \\ \hline 3 & & & & & & \\ \hline 4 & & & & & & \\ \hline 5 & & & & & & \\ \hline \end{tabular} \begin{tabular}{|c|c|c|c|c|c|c|} \hline \multicolumn{1}{|c|}{} & \multicolumn{6}{|c|}{ Real GDP Growth Rates } \\ \hline Year & Base Year 1 & Base Year 2 & Base Year 3 & Base Year 4 & Base Year 5 & Chain Weighted \\ \hline 12 & & & & & & \\ \hline 23 & & & & & & \\ \hline 34 & & & & & & \\ \hline 45 & & & & & & \\ \hline \end{tabular} \begin{tabular}{|c|c|c|c|c|c|c|} \cline { 2 - 8 } & \multicolumn{6}{|c|}{ Price Indices (CPI method) } \\ \hline Year & Base Year 1 & Base Year 2 & Base Year 3 & Base Year 4 & Base Year 5 & Chain Weighted \\ \hline 1 & & & & & & \\ \hline 2 & & & & & & \\ \hline 3 & & & & & & \\ \hline 4 & & & & & & \\ \hline 5 & & & & & & \\ \hline \end{tabular} \begin{tabular}{|c|c|c|c|c|c|c|} \hline \multicolumn{1}{|c|}{} & \multicolumn{6}{|c|}{ Inflation Rates (using CPI) } \\ \hline Year & Base Year 1 & Base Year 2 & Base Year 3 & Base Year 4 & Base Year 5 & Chain Weighted \\ \hline 12 & & & & & & \\ \hline 23 & & & & & & \\ \hline 34 & & & & & & \\ \hline 45 & & & & & & \\ \hline \end{tabular} \begin{tabular}{|c|c|c|c|c|c|c|} \cline { 2 - 8 } & \multicolumn{6}{|c|}{ Implicit Price Indices } \\ \hline Year & Base Year 1 & Base Year 2 & Base Year 3 & Base Year 4 & Base Year 5 & Chain Weighted \\ \hline 1 & & & & & & \\ \hline 2 & & & & & & \\ \hline 3 & & & & & & \\ \hline 4 & & & & & & \\ \hline 5 & & & & & & \\ \hline \end{tabular} Inflation Rates (ueinn Imnlicit Price Indieas) \begin{tabular}{|c|c|c|c|c|} \hline \multicolumn{1}{|c|}{ A } & B & C & E \\ \hline Year & \multicolumn{2}{|c|}{ Apples } & \multicolumn{2}{c|}{ Bananas } \\ \hline 1 & Price & Quant. & Price & Quant. \\ \hline 2 & 12 & 26 & 5 & 44 \\ \hline 3 & 16 & 28 & 4 & 47 \\ \hline 4 & 11 & 29 & 11 & 48 \\ \hline 5 & 15 & 30 & 10 & 50 \\ \hline \end{tabular} \begin{tabular}{|c|} \hline Nominal GDP \\ \hline 532 \\ \hline 636 \\ \hline 847 \\ \hline 950 \\ \hline 1278 \\ \hline \end{tabular} \begin{tabular}{|c|c|c|c|c|c|c|} \cline { 2 - 9 } & \multicolumn{6}{|c|}{ Year } \\ \hline \multirow{2}{*}{ Year } & Base Year 1 & Base Year 2 & Base Year 3 & Base Year 4 & Base Year 5 & Chain Weighted \\ \hline 1 & & & & & & 100 \\ \hline 2 & & & & & & \\ \hline 3 & & & & & & \\ \hline 4 & & & & & & \\ \hline 5 & & & & & & \\ \hline \end{tabular} \begin{tabular}{|c|c|c|c|c|c|c|} \hline \multicolumn{1}{|c|}{} & \multicolumn{6}{|c|}{ Real GDP Growth Rates } \\ \hline Year & Base Year 1 & Base Year 2 & Base Year 3 & Base Year 4 & Base Year 5 & Chain Weighted \\ \hline 12 & & & & & & \\ \hline 23 & & & & & & \\ \hline 34 & & & & & & \\ \hline 45 & & & & & & \\ \hline \end{tabular} \begin{tabular}{|c|c|c|c|c|c|c|} \cline { 2 - 8 } & \multicolumn{6}{|c|}{ Price Indices (CPI method) } \\ \hline Year & Base Year 1 & Base Year 2 & Base Year 3 & Base Year 4 & Base Year 5 & Chain Weighted \\ \hline 1 & & & & & & \\ \hline 2 & & & & & & \\ \hline 3 & & & & & & \\ \hline 4 & & & & & & \\ \hline 5 & & & & & & \\ \hline \end{tabular} \begin{tabular}{|c|c|c|c|c|c|c|} \hline \multicolumn{1}{|c|}{} & \multicolumn{6}{|c|}{ Inflation Rates (using CPI) } \\ \hline Year & Base Year 1 & Base Year 2 & Base Year 3 & Base Year 4 & Base Year 5 & Chain Weighted \\ \hline 12 & & & & & & \\ \hline 23 & & & & & & \\ \hline 34 & & & & & & \\ \hline 45 & & & & & & \\ \hline \end{tabular} \begin{tabular}{|c|c|c|c|c|c|c|} \cline { 2 - 8 } & \multicolumn{6}{|c|}{ Implicit Price Indices } \\ \hline Year & Base Year 1 & Base Year 2 & Base Year 3 & Base Year 4 & Base Year 5 & Chain Weighted \\ \hline 1 & & & & & & \\ \hline 2 & & & & & & \\ \hline 3 & & & & & & \\ \hline 4 & & & & & & \\ \hline 5 & & & & & & \\ \hline \end{tabular} Inflation Rates (ueinn Imnlicit Price Indieas)
Step by Step Solution
There are 3 Steps involved in it

Get step-by-step solutions from verified subject matter experts