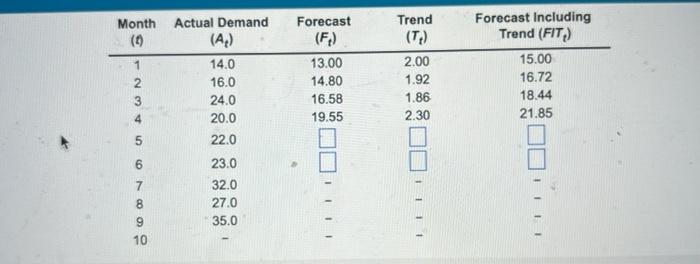
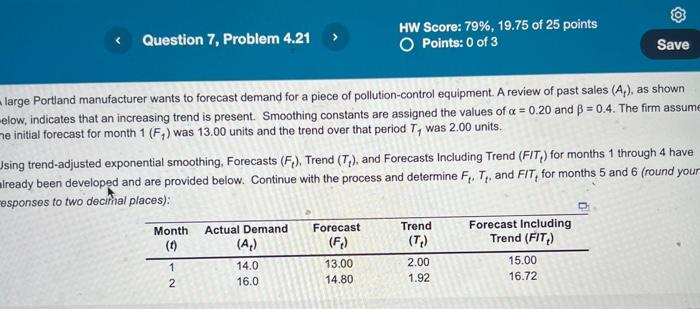
Question: begin{tabular}{ccccc} Month (t) & Actual Demand (At) & Forecast (Ft) & Trend (Tt) & Forecast Including Trend (FTt) hline 1 & 14.0 & 13.00

\begin{tabular}{ccccc} Month (t) & Actual Demand
\begin{tabular}{ccccc} Month (t) & Actual Demand (At) & Forecast (Ft) & Trend (Tt) & Forecast Including Trend (FTt) \\ \hline 1 & 14.0 & 13.00 & 2.00 & 15.00 \\ 2 & 16.0 & 14.80 & 1.92 & 16.72 \\ 3 & 24.0 & 16.58 & 1.86 & 18.44 \\ 4 & 20.0 & 19.55 & 2.30 & 21.85 \\ 5 & 22.0 & & & \\ 6 & 23.0 & & & \\ \hline & 32.0 & & & \\ 9 & 27.0 & & & \\ \hline 10 & & & & \end{tabular} large Portland manufacturer wants to forecast demand for a piece of pollution-control equipment. A review of past sales ( At), as shown elow, indicates that an increasing trend is present. Smoothing constants are assigned the values of =0.20 and =0.4. The firm assumt 1e initial forecast for month 1(F1) was 13.00 units and the trend over that period T1 was 2.00 units. Ising trend-adjusted exponential smoothing. Forecasts (Ft), Trend (Tt), and Forecasts Including Trend (FITt) for months 1 through 4 have Iready been developed and are provided below. Continue with the process and determine Ft,Tt, and FITt for months 5 and 6 (round your asponses to two decithal places)

Step by Step Solution

There are 3 Steps involved in it

1 Expert Approved Answer
Step: 1 Unlock blur-text-image
Question Has Been Solved by an Expert!

Get step-by-step solutions from verified subject matter experts

Step: 2 Unlock
Step: 3 Unlock

Students Have Also Explored These Related General Management Questions!