

Question: begin{tabular}{|c|c|c|c|c|c|} hline ProcurementCost($) & Probability & LaborCost($) & Probability & TransportationCost($) & Probability hline 10 & 0.25 & 20 & 0.10 & 3 &
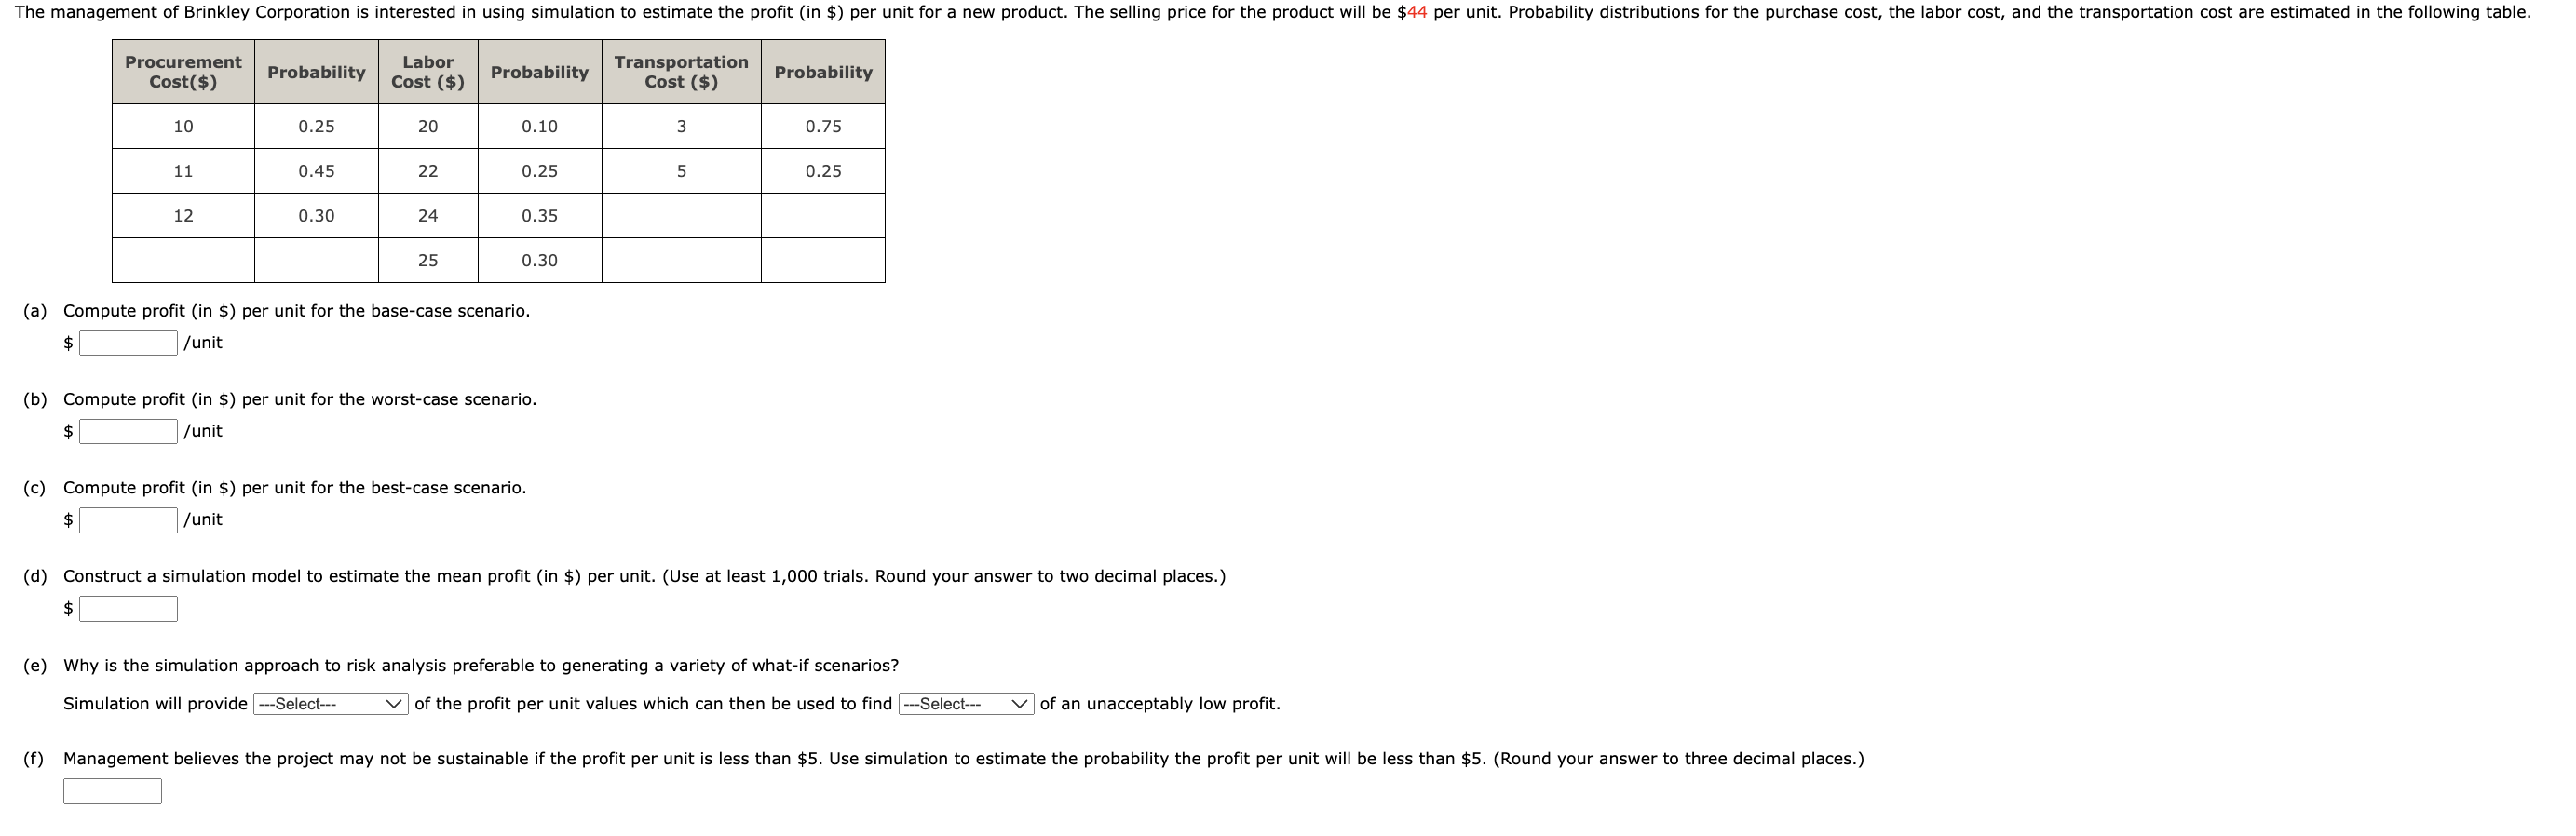
\begin{tabular}{|c|c|c|c|c|c|} \hline ProcurementCost($) & Probability & LaborCost($) & Probability & TransportationCost($) & Probability \\ \hline 10 & 0.25 & 20 & 0.10 & 3 & 0.75 \\ \hline 11 & 0.45 & 22 & 0.25 & 5 & 0.25 \\ \hline 12 & 0.30 & 24 & 0.35 & & \\ \hline & & 25 & 0.30 & & \\ \hline \end{tabular} (a) Compute profit (in $ ) per unit for the base-case scenario. /unit (b) Compute profit (in \$) per unit for the worst-case scenario $ /unit (c) Compute profit (in $ ) per unit for the best-case scenario. /unit (d) Construct a simulation model to estimate the mean profit (in \$) per unit. (Use at least 1,000 trials. Round your answer to two decimal places.) (e) Why is the simulation approach to risk analysis preferable to generating a variety of what-if scenarios? Simulation will provide -- Select--- V of the profit per unit values which can then be used to find -- Select-- V of an unacceptably low profit
Step by Step Solution
There are 3 Steps involved in it

Get step-by-step solutions from verified subject matter experts