

Question: begin{tabular}{|c|c|c|c|c|c|c|c|} hline 11. TIE (Interest coverage) & & & & & 79.10 & & times hline 12. Operating profit margin & % & %
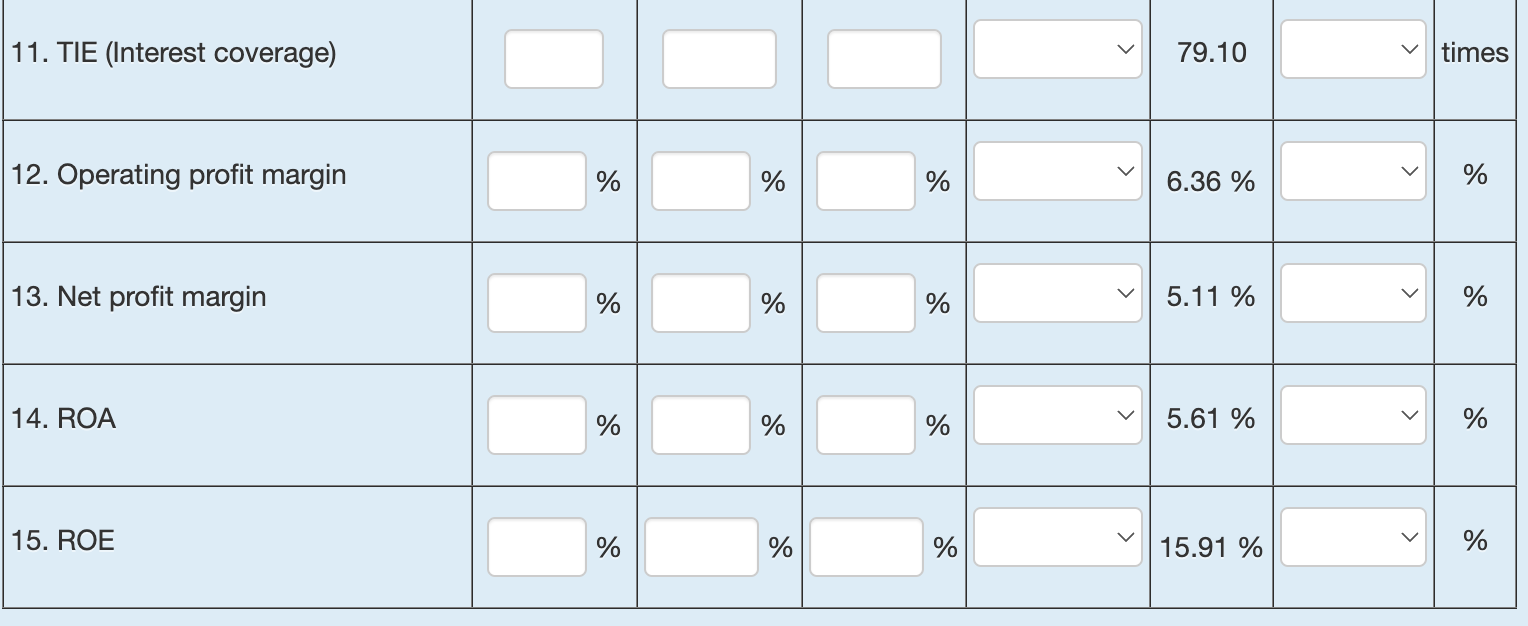
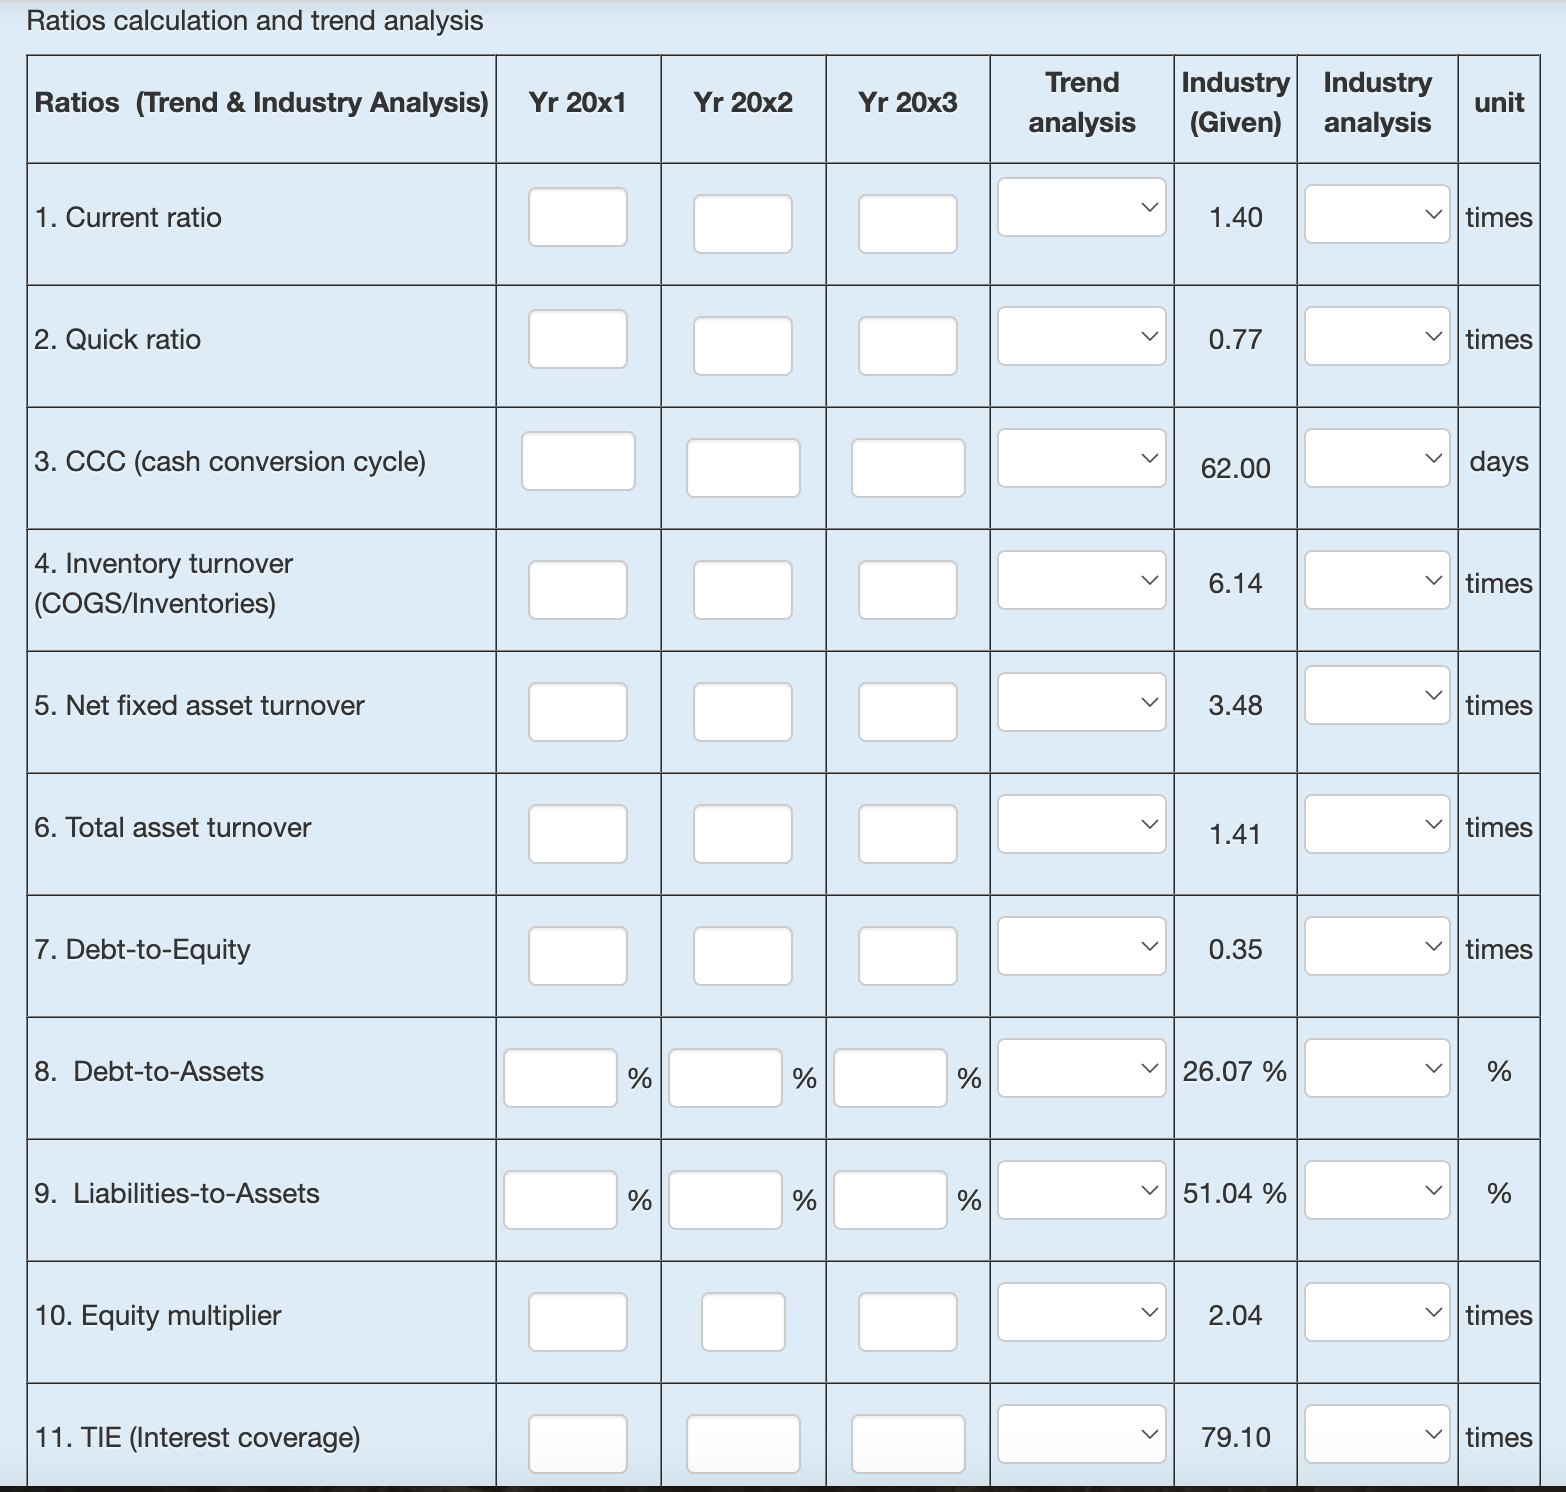
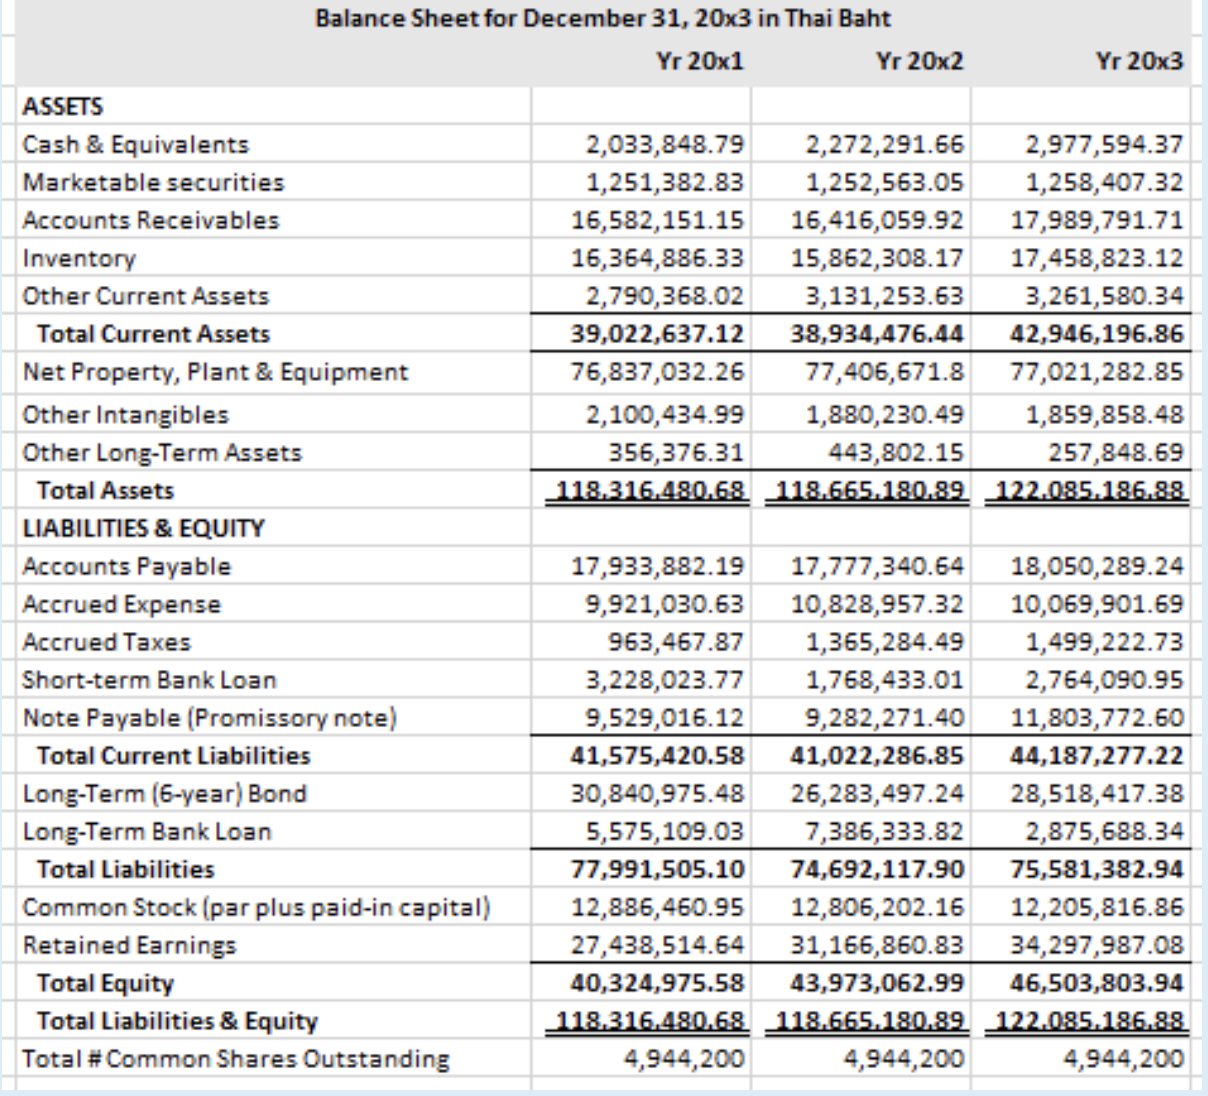
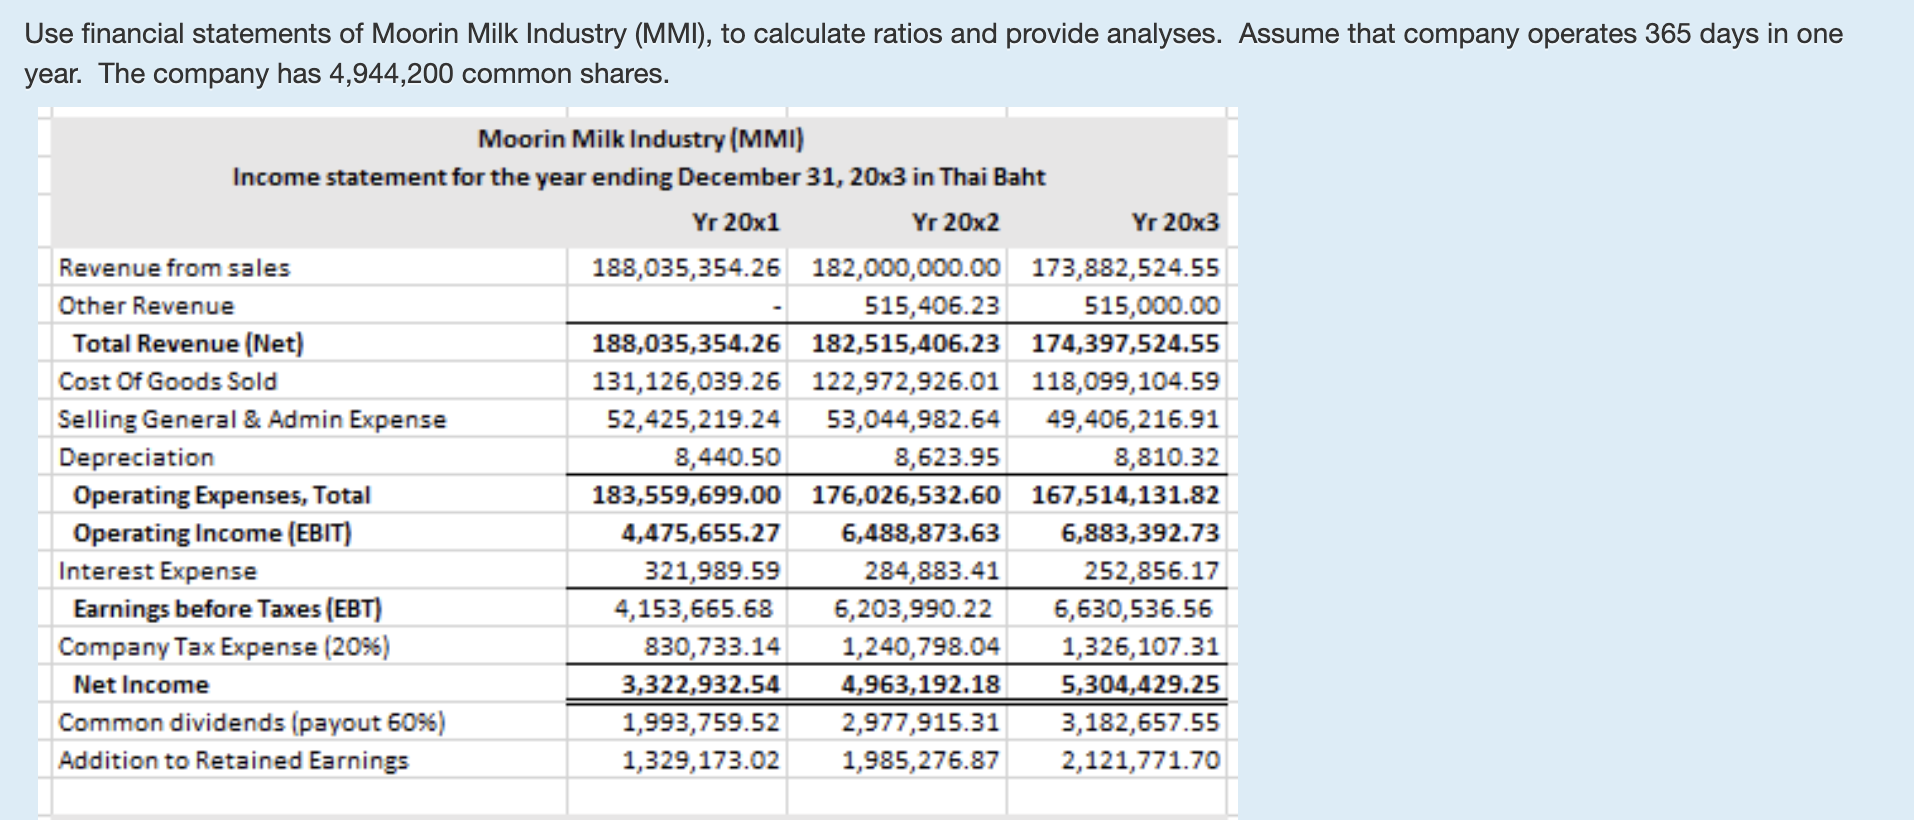
\begin{tabular}{|c|c|c|c|c|c|c|c|} \hline 11. TIE (Interest coverage) & & & & & 79.10 & & times \\ \hline 12. Operating profit margin & % & % & % & v & 6.36% & & % \\ \hline 13. Net profit margin & % & % & % & & 5.11% & & % \\ \hline 14. ROA & % & % & % & & 5.61% & & % \\ \hline 15. ROE & % & % & % & & 15.91% & & % \\ \hline \end{tabular} Ratios calculation and trend analysis \begin{tabular}{|c|c|c|c|c|c|c|c|} \hline Ratios (Trend \& Industry Analysis) & Yr 20x1 & Yr 20x2 & Yr 20x3 & Trendanalysis & Industry(Given) & Industryanalysis & unit \\ \hline 1. Current ratio & & & & & 1.40 & & times \\ \hline 2. Quick ratio & & & & & 0.77 & & times \\ \hline 3. CCC (cash conversion cycle) & & & & & 62.00 & & days \\ \hline 4.Inventoryturnover(COGS/Inventories) & & & & & 6.14 & & times \\ \hline 5. Net fixed asset turnover & & & & & 3.48 & & times \\ \hline 6. Total asset turnover & & & & v & 1.41 & & times \\ \hline 7. Debt-to-Equity & & & & & 0.35 & & times \\ \hline 8. Debt-to-Assets & % & % & % & v & 26.07% & & % \\ \hline 9. Liabilities-to-Assets & % & % & % & & 51.04% & & % \\ \hline 10. Equity multiplier & & & & & 2.04 & & times \\ \hline 11. TIE (Interest coverage) & & & & & 79.10 & & times \\ \hline \end{tabular} Use financial statements of Moorin Milk Industry (MMI), to calculate ratios and provide analyses. Assume that company operates 365 days in one year. The company has 4,944,200 common shares. \begin{tabular}{|c|c|c|c|c|c|c|c|} \hline 11. TIE (Interest coverage) & & & & & 79.10 & & times \\ \hline 12. Operating profit margin & % & % & % & v & 6.36% & & % \\ \hline 13. Net profit margin & % & % & % & & 5.11% & & % \\ \hline 14. ROA & % & % & % & & 5.61% & & % \\ \hline 15. ROE & % & % & % & & 15.91% & & % \\ \hline \end{tabular} Ratios calculation and trend analysis \begin{tabular}{|c|c|c|c|c|c|c|c|} \hline Ratios (Trend \& Industry Analysis) & Yr 20x1 & Yr 20x2 & Yr 20x3 & Trendanalysis & Industry(Given) & Industryanalysis & unit \\ \hline 1. Current ratio & & & & & 1.40 & & times \\ \hline 2. Quick ratio & & & & & 0.77 & & times \\ \hline 3. CCC (cash conversion cycle) & & & & & 62.00 & & days \\ \hline 4.Inventoryturnover(COGS/Inventories) & & & & & 6.14 & & times \\ \hline 5. Net fixed asset turnover & & & & & 3.48 & & times \\ \hline 6. Total asset turnover & & & & v & 1.41 & & times \\ \hline 7. Debt-to-Equity & & & & & 0.35 & & times \\ \hline 8. Debt-to-Assets & % & % & % & v & 26.07% & & % \\ \hline 9. Liabilities-to-Assets & % & % & % & & 51.04% & & % \\ \hline 10. Equity multiplier & & & & & 2.04 & & times \\ \hline 11. TIE (Interest coverage) & & & & & 79.10 & & times \\ \hline \end{tabular} Use financial statements of Moorin Milk Industry (MMI), to calculate ratios and provide analyses. Assume that company operates 365 days in one year. The company has 4,944,200 common shares
Step by Step Solution
There are 3 Steps involved in it

Get step-by-step solutions from verified subject matter experts