

Question: begin{tabular}{ccc|ccc|cc} hline Hour & x & R & Hour & x & R & Hour & x hline 1 & 3.15 & 0.76 &
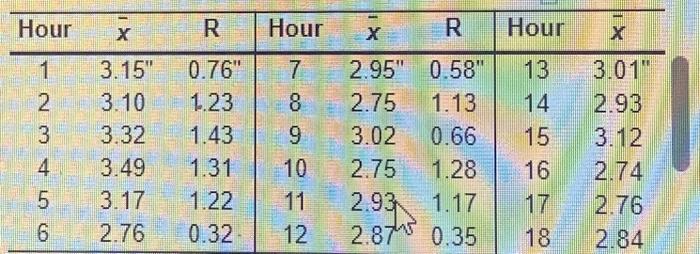
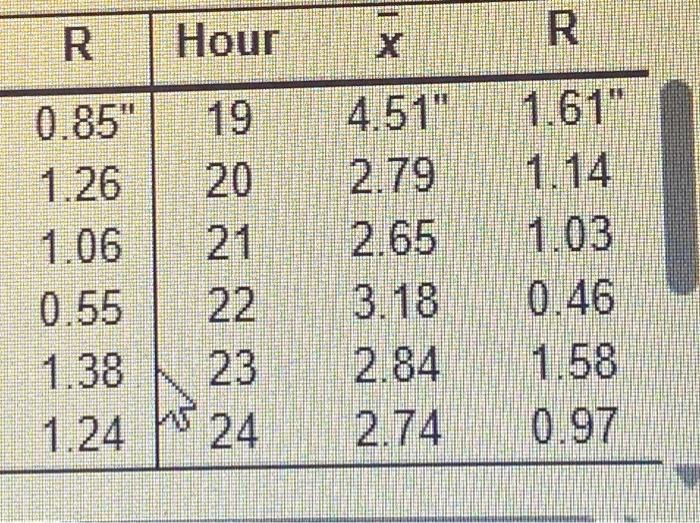
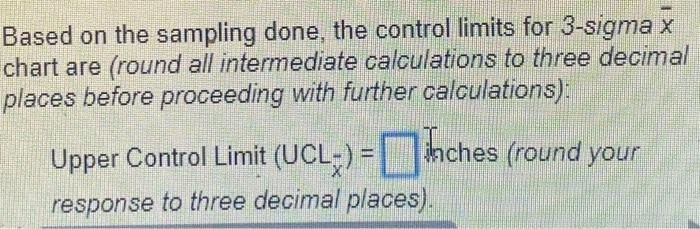
\begin{tabular}{ccc|ccc|cc} \hline Hour & x & R & Hour & x & R & Hour & x \\ \hline 1 & 3.15 & 0.76 & 7 & 2.95 & 0.58 & 13 & 3.01 \\ 2 & 3.10 & 1.23 & 8 & 2.75 & 1.13 & 14 & 2.93 \\ 3 & 3.32 & 1.43 & 9 & 3.02 & 0.66 & 15 & 3.12 \\ 4 & 3.49 & 1.31 & 10 & 2.75 & 1.28 & 16 & 2.74 \\ 5 & 3.17 & 1.22 & 11 & 2.93 & 1.17 & 17 & 2.76 \\ 6 & 2.76 & 0.32 & 12 & 2.87 & 0.35 & 18 & 2.84 \\ \hline \end{tabular} Based on the sampling done, the control limits for 3 -sigma x chart are (round all intermediate calculations to three decimal places before proceeding with further calculations): Upper Control Limit (UCL)=Whches (round your response to three decimal places). Sampling 4 pieces of precision-cut wire (to be used in computer assembly) every hour for the past 24 hours has produced the following results: \begin{tabular}{c|ccc} \hline R & Hour & x & R \\ \hline 0.85 & 19 & 4.51 & 1.61 \\ 1.26 & 20 & 2.79 & 1.14 \\ 1.06 & 21 & 2.65 & 1.03 \\ 0.55 & 22 & 3.18 & 0.46 \\ 1.38 & 23 & 2.84 & 1.58 \\ 1.24 & 24 & 2.74 & 0.97 \\ \hline \end{tabular}
Step by Step Solution
There are 3 Steps involved in it

Get step-by-step solutions from verified subject matter experts