

Question: begin{tabular}{|c|c|c|c|c|c|c|c|c|c|} hline & A & B & C & D & E & F & G & H & 1 hline 1. & multicolumn{2}{|c|}{
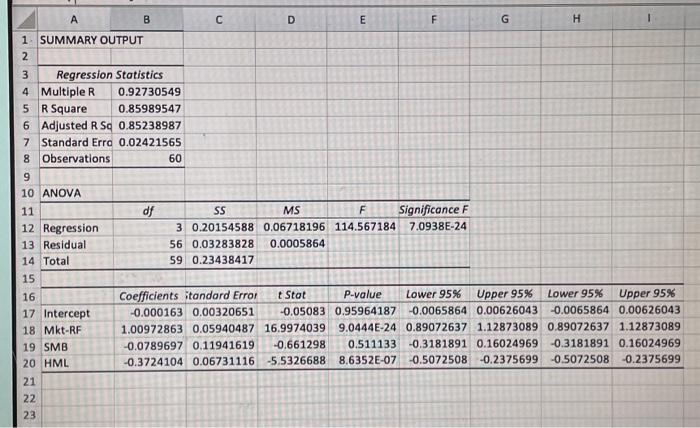
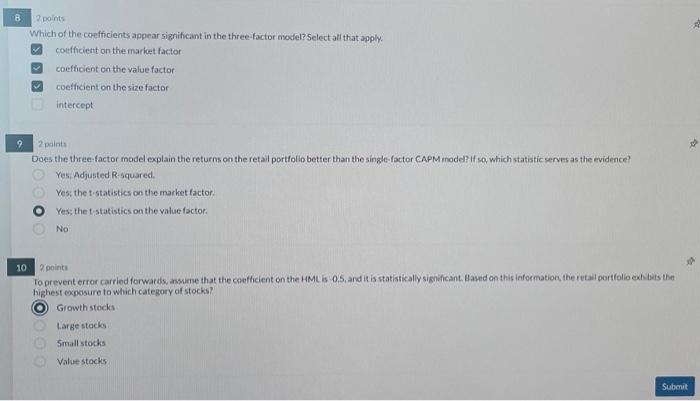
\begin{tabular}{|c|c|c|c|c|c|c|c|c|c|} \hline & A & B & C & D & E & F & G & H & 1 \\ \hline 1. & \multicolumn{2}{|c|}{ SUMMARY OUTPUT } & & & 18 & & & & \\ \hline 2 & & & & t & & & & & \\ \hline 3 & \multicolumn{2}{|c|}{ Regression Statistics } & & & & & & & \\ \hline 4 & Multiple R & 0.92730549 & & & & & & & \\ \hline 5 & R Square & 0.85989547 & & & & & & & \\ \hline 6 & Adjusted R Sq & 0.85238987 & & & & & & & \\ \hline 7 & Standard Erro & 0.02421565 & & & & & & & \\ \hline 8 & Observations & 60 & & & & & & & \\ \hline 9 & & & 2 & & & & & & \\ \hline 10 & ANOVA & & & & & & & & \\ \hline 11 & & df & SS & MS & F & Significance F & & & \\ \hline 12 & Regression & 3 & 0.20154588 & 0.06718196 & 114.567184 & 7.0938E24 & & & \\ \hline 13 & Residual & 56 & 0.03283828 & 0.0005864 & & & & & \\ \hline 14 & Total & 59 & 0.23438417 & & & & & & \\ \hline 15 & & & & & & & & & \\ \hline 16 & & Coefficients : & itandard Error & t Stat & P-value & Lower 95\% & Upper 95\% & Lower 95\% & Upper 95\% \\ \hline 17 & Intercept & -0.000163 & 0.00320651 & -0.05083 & 0.95964187 & -0.0065864 & 0.00626043 & -0.0065864 & 0.00626043 \\ \hline 18 & Mkt-RF & 1.00972863 & 0.05940487 & 16.9974039 & 9.0444E24 & 0.89072637 & 1.12873089 & 0.89072637 & 1.12873089 \\ \hline 19 & SMB & -0.0789697 & 0.11941619 & -0.661298 & 0.511133 & -0.3181891 & 0.16024969 & -0.3181891 & 0.16024969 \\ \hline 20 & HML & -0.3724104 & 0.06731116 & -5.5326688 & 8.6352E07 & -0.5072508 & -0.2375699 & -0.5072508 & -0.2375699 \\ \hline 21 & & & & & & & & & \\ \hline 22 & & & & & & & & & \\ \hline 23 & & & & & & & & & \\ \hline \end{tabular} 2points Which of the coefficients appear significant in the three-factor model? Select all that apply. coefficient on the market factor coefficient on the value factor coefficient on the size factor intercept 2 paints Does the three-factor model explain the returns on the retail portfolio better than the single-factor CAPM inodel? if sa which statistic serves as the evidence? Yes, Adjusted R-squared. Yes: the t-statistics on the market factor. Yes; the t-statistics on the value factor. No 2 points To prevent error carried forwards, ansume that the coefficient on the HML is - 0.5 , and it is statistically significant. Based on this information, the retal portfolio exh ibits the highest exposure to which category of stocks? Growth stocks Larke stocks Small stocks Value stocks
Step by Step Solution
There are 3 Steps involved in it

Get step-by-step solutions from verified subject matter experts