

Question: begin{tabular}{|l|l|} hline Parameter & Value hline Ks & 60mg/LBOD5 hline kd & 0.10d/ day hlinem & 3l/ day hline Y &
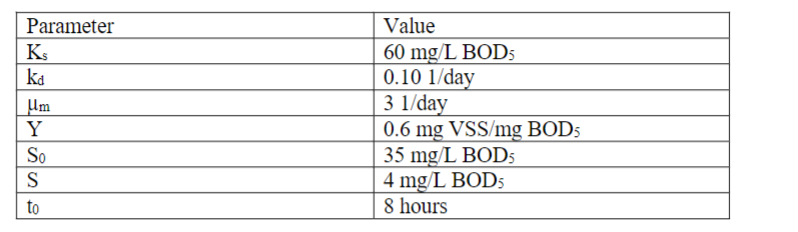

\begin{tabular}{|l|l|} \hline Parameter & Value \\ \hline Ks & 60mg/LBOD5 \\ \hline kd & 0.10d/ day \\ \hlinem & 3l/ day \\ \hline Y & 0.6mgVSS/mgBOD5 \\ \hline S0 & 35mg/LBODBO5 \\ \hline S & 4mg/LBOD5 \\ \hline t0 & 8 hours \\ \hline \end{tabular} 5. Use the parameters given above to answer the following ( 20 points): A. Plot both steady state concentration ( y-axis) for X and S with values for SRT (c)(x-axis) ranging from 2 to 20 days. Ensure your intervals are at least one day. Describe how values for X and S change as SRT increases. B. How does varying HRT ( t0 ) change the values for X and S across this range of SRT (c) ? Why do you think this is? Provide additional plots or other explanations to justify your answer. \begin{tabular}{|l|l|} \hline Parameter & Value \\ \hline Ks & 60mg/LBOD5 \\ \hline kd & 0.10d/ day \\ \hlinem & 3l/ day \\ \hline Y & 0.6mgVSS/mgBOD5 \\ \hline S0 & 35mg/LBODBO5 \\ \hline S & 4mg/LBOD5 \\ \hline t0 & 8 hours \\ \hline \end{tabular} 5. Use the parameters given above to answer the following ( 20 points): A. Plot both steady state concentration ( y-axis) for X and S with values for SRT (c)(x-axis) ranging from 2 to 20 days. Ensure your intervals are at least one day. Describe how values for X and S change as SRT increases. B. How does varying HRT ( t0 ) change the values for X and S across this range of SRT (c) ? Why do you think this is? Provide additional plots or other explanations to justify your
Step by Step Solution
There are 3 Steps involved in it

Get step-by-step solutions from verified subject matter experts