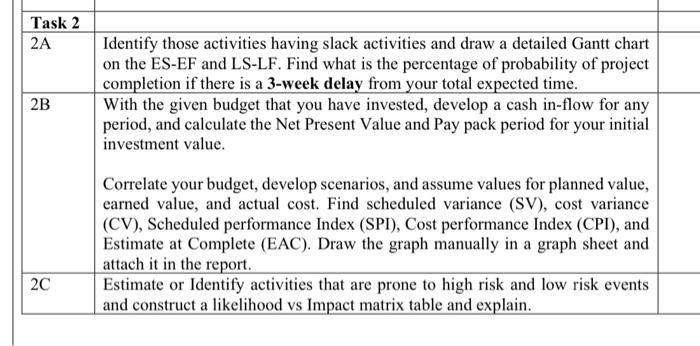
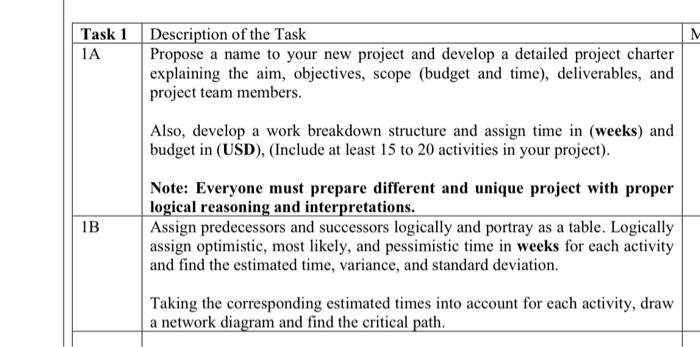
Question: begin{tabular}{|l|l|l|} hline 2A & Identify those activities having slack activities and draw a detailed Gantt chart on the ES-EF and LS-LF. Find what is the

\begin{tabular}{|l|l|l|} \hline 2A & Identify
\begin{tabular}{|l|l|l|} \hline 2A & Identify those activities having slack activities and draw a detailed Gantt chart on the ES-EF and LS-LF. Find what is the percentage of probability of project completion if there is a 3-week delay from your total expected time. \\ \hline 2B & With the given budget that you have invested, develop a cash in-flow for any period, and calculate the Net Present Value and Pay pack period for your initial investment value. \\ Correlate your budget, develop scenarios, and assume values for planned value, earned value, and actual cost. Find scheduled variance (SV), cost variance (CV), Scheduled performance Index (SPI), Cost performance Index (CPI), and Estimate at Complete (EAC). Draw the graph manually in a graph sheet and attach it in the report. \\ \hline 2C & Estimate or Identify activities that are prone to high risk and low risk events and construct a likelihood vs Impact matrix table and explain. \\ \hline \end{tabular} \begin{tabular}{|l|l|l|} \hline Task 1 & Description of the Task & M \\ \hline 1A & Propose a name to your new project and develop a detailed project charter explaining the aim, objectives, scope (budget and time), deliverables, and project team members. \\ & Also, develop a work breakdown structure and assign time in (weeks) and budget in (USD), (Include at least 15 to 20 activities in your project). Note: Everyone must prepare different and unique project with proper logical reasoning and interpretations. & \\ \hline 1B & Assign predecessors and successors logically and portray as a table. Logically assign optimistic, most likely, and pessimistic time in weeks for each activity and find the estimated time, variance, and standard deviation. \\ \hline Taking the corresponding estimated times into account for each activity, draw a network diagram and find the critical path. \\ \hline \end{tabular}

Step by Step Solution

There are 3 Steps involved in it

1 Expert Approved Answer
Step: 1 Unlock blur-text-image
Question Has Been Solved by an Expert!

Get step-by-step solutions from verified subject matter experts

Step: 2 Unlock
Step: 3 Unlock

Students Have Also Explored These Related General Management Questions!