

Question: begin{tabular}{|l|l|l|l|} hline & 2017 & 2018 hline Summer & 92 & 19 hline Fall & 88 & 5019 hline Winter & 48
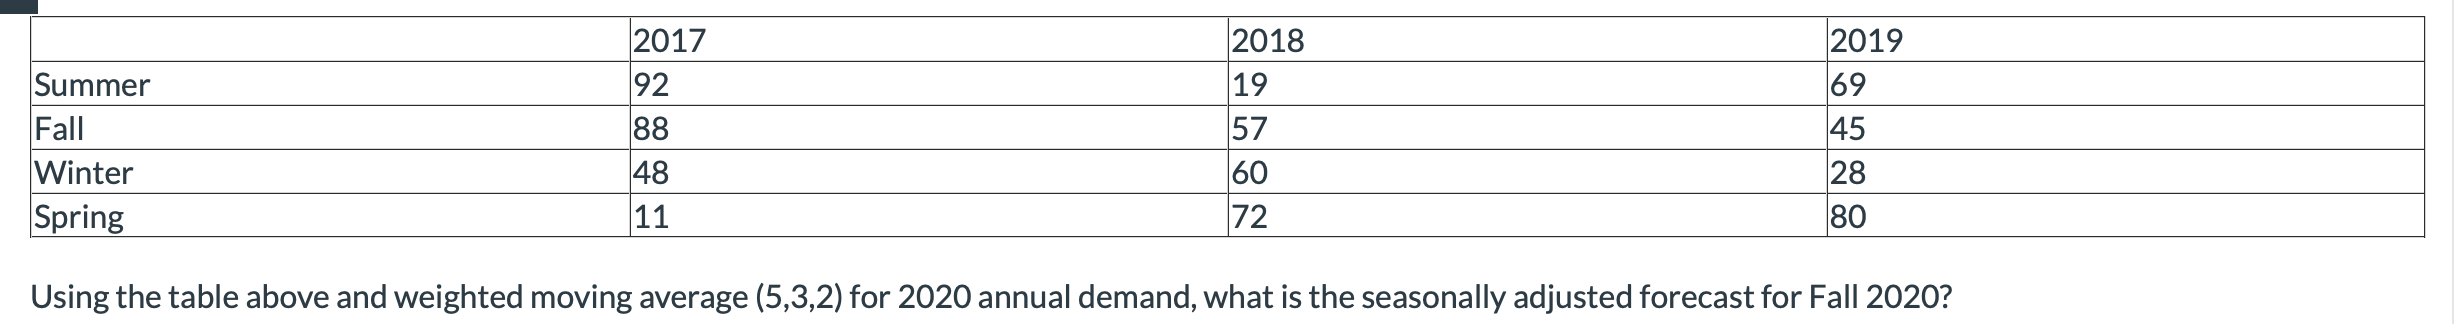
\begin{tabular}{|l|l|l|l|} \hline & 2017 & 2018 \\ \hline Summer & 92 & 19 \\ \hline Fall & 88 & 5019 \\ \hline Winter & 48 & 67 \\ \hline Spring & 11 & 60 \\ \hline \end{tabular} Using the table above and weighted moving average (5,3,2) for 2020 annual demand, what is the seasonally adjusted forecast for Fall 2020
Step by Step Solution
There are 3 Steps involved in it
1 Expert Approved Answer
Step: 1 Unlock

Question Has Been Solved by an Expert!
Get step-by-step solutions from verified subject matter experts
Step: 2 Unlock
Step: 3 Unlock