

Question: begin{tabular}{l|rrrr} hline & Cost/valve & % small & % medium & % large cline { 1 - 3 } Supplier 1 & $20 &
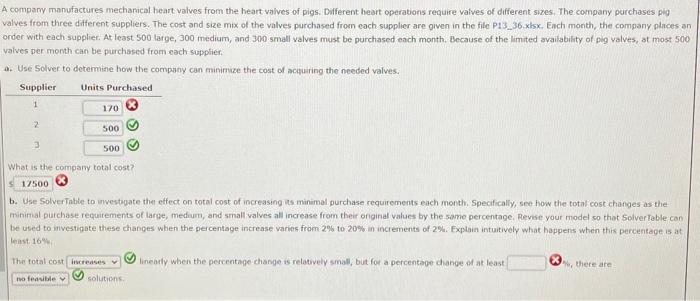
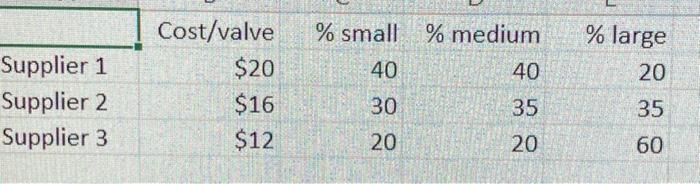

\begin{tabular}{l|rrrr} \hline & Cost/valve & % small & % medium & \% large \\ \cline { 1 - 3 } Supplier 1 & $20 & 40 & 40 & 20 \\ Supplier 2 & $16 & 30 & 35 & 35 \\ Supplier 3 & $12 & 20 & 20 & 60 \end{tabular} Please provide steps and answers. A compary manufactures mecharical heart valves from the heart valves of pigs. Different heart operations require valves of different sizes, The company purchases pig valves from three different suppliers. The cost and size mix of the valves purchased from each supplier are given in the file P13_ 36 .xhx, Each month, the company places an order with each suppliet. At least 500 targe, 300 medium, and 300 small valves must be purchased each month. Because of the limited availability of pig valves, at most 500 valves per month can be purchased from each supplier. a. Use Solver to determine how the company can minimize the cost of achuiring the needed valves. What is the compary total cost? b. Use Solver Table to unestopate thet effect on total cost of increasing ins minimal purchase requirements each month. Specifically, see how the total cost changes as the minimal purchase requitements of larpe, medium, and small valves all increase from their onginal values by the some percentage, Revise your model so that Solver fable can be used to investigate these changes when the percentage increase varies from 2% to 20% in increments of 2%. Explain intuitively what happens when this percentage is at thast 16%. Ther total cost linearly when the percentage change is relatively small, but for a percentape change of at least Q solutions
Step by Step Solution
There are 3 Steps involved in it

Get step-by-step solutions from verified subject matter experts