

Question: begin{tabular}{rrr} A & B & multicolumn{1}{l}{C} 1 & 2 & 3 124 & 3.5 & 78 150 & 3.8 & 55
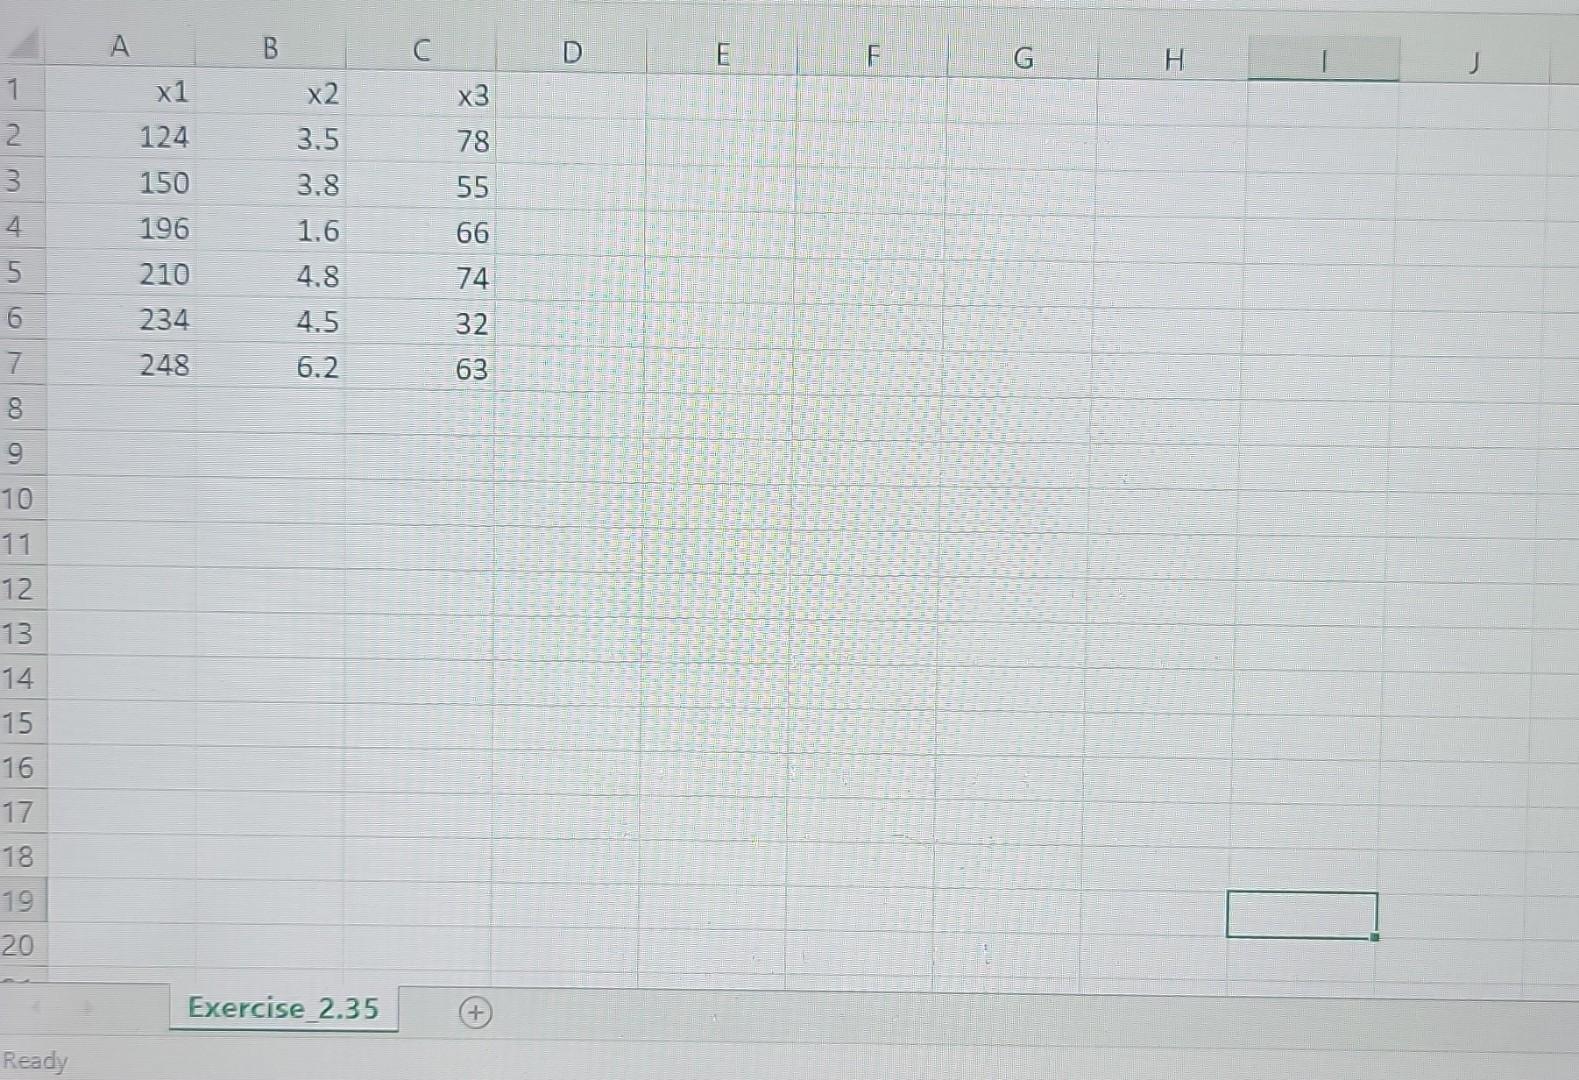
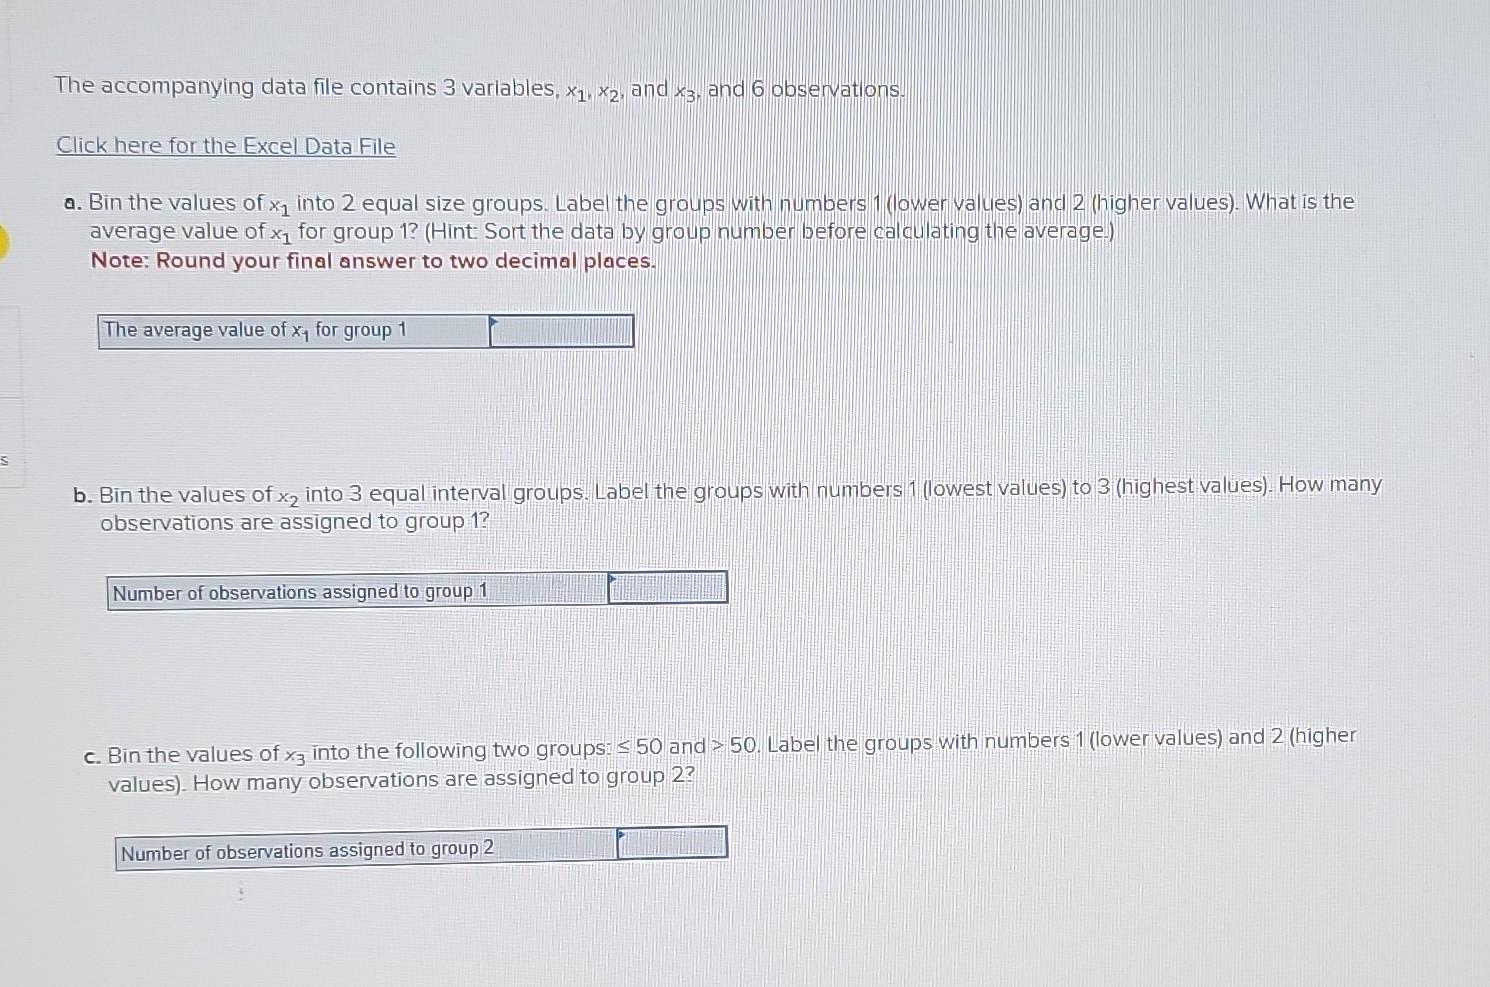
\begin{tabular}{rrr} A & B & \multicolumn{1}{l}{C} \\ 1 & 2 & 3 \\ 124 & 3.5 & 78 \\ 150 & 3.8 & 55 \\ 196 & 1.6 & 66 \\ 210 & 4.8 & 74 \\ 234 & 4.5 & 32 \\ 248 & 6.2 & 63 \end{tabular} Exercise_2.35 (+) The accompanying data file contains 3 variables, x1,x2, and x3, and 6 observations. Click here for the Excel Data File a. Bin the values of x1 into 2 equal size groups. Label the groups with numbers 1 (lower values) and 2 (higher values). What is the average value of x1 for group 1? (Hint: Sort the data by group number before calculating the average) Note: Round your final answer to two decimal places. b. Bin the values of x2 into 3 equal interval groups. Label the groups with numbers 1 (lowest values) to 3 (highest values). How many observations are assigned to group 1? c. Bin the values of x3 into the following two groups: 50 and >50. Label the groups with numbers 1 (lower values) and 2 (higher values). How many observations are assigned to group 2
Step by Step Solution
There are 3 Steps involved in it

Get step-by-step solutions from verified subject matter experts