

Question: (BELLOW IS THE FORMAT TO ANSWE QUESTION) (BELLOW IS THE FORMAT TO ANSWE QUESTION) The historical sales of automobile batteries from 2007 to 2019 of
(BELLOW IS THE FORMAT TO ANSWE QUESTION)
(BELLOW IS THE FORMAT TO ANSWE QUESTION)
The historical sales of automobile batteries from 2007 to 2019 of ALSET Co. are provided in the table below and given in the Excel file named Template 3.xlsx:
| Year | Sales (1,000 Units) |
| 2007 | 100 |
| 2008 | 110 |
| 2009 | 122 |
| 2010 | 130 |
| 2011 | 139 |
| 2012 | 152 |
| 2013 | 164 |
| 2014 | 168 |
| 2015 | 177 |
| 2016 | 179 |
| 2017 | 186 |
| 2018 | 190 |
| 2019 | 202 |
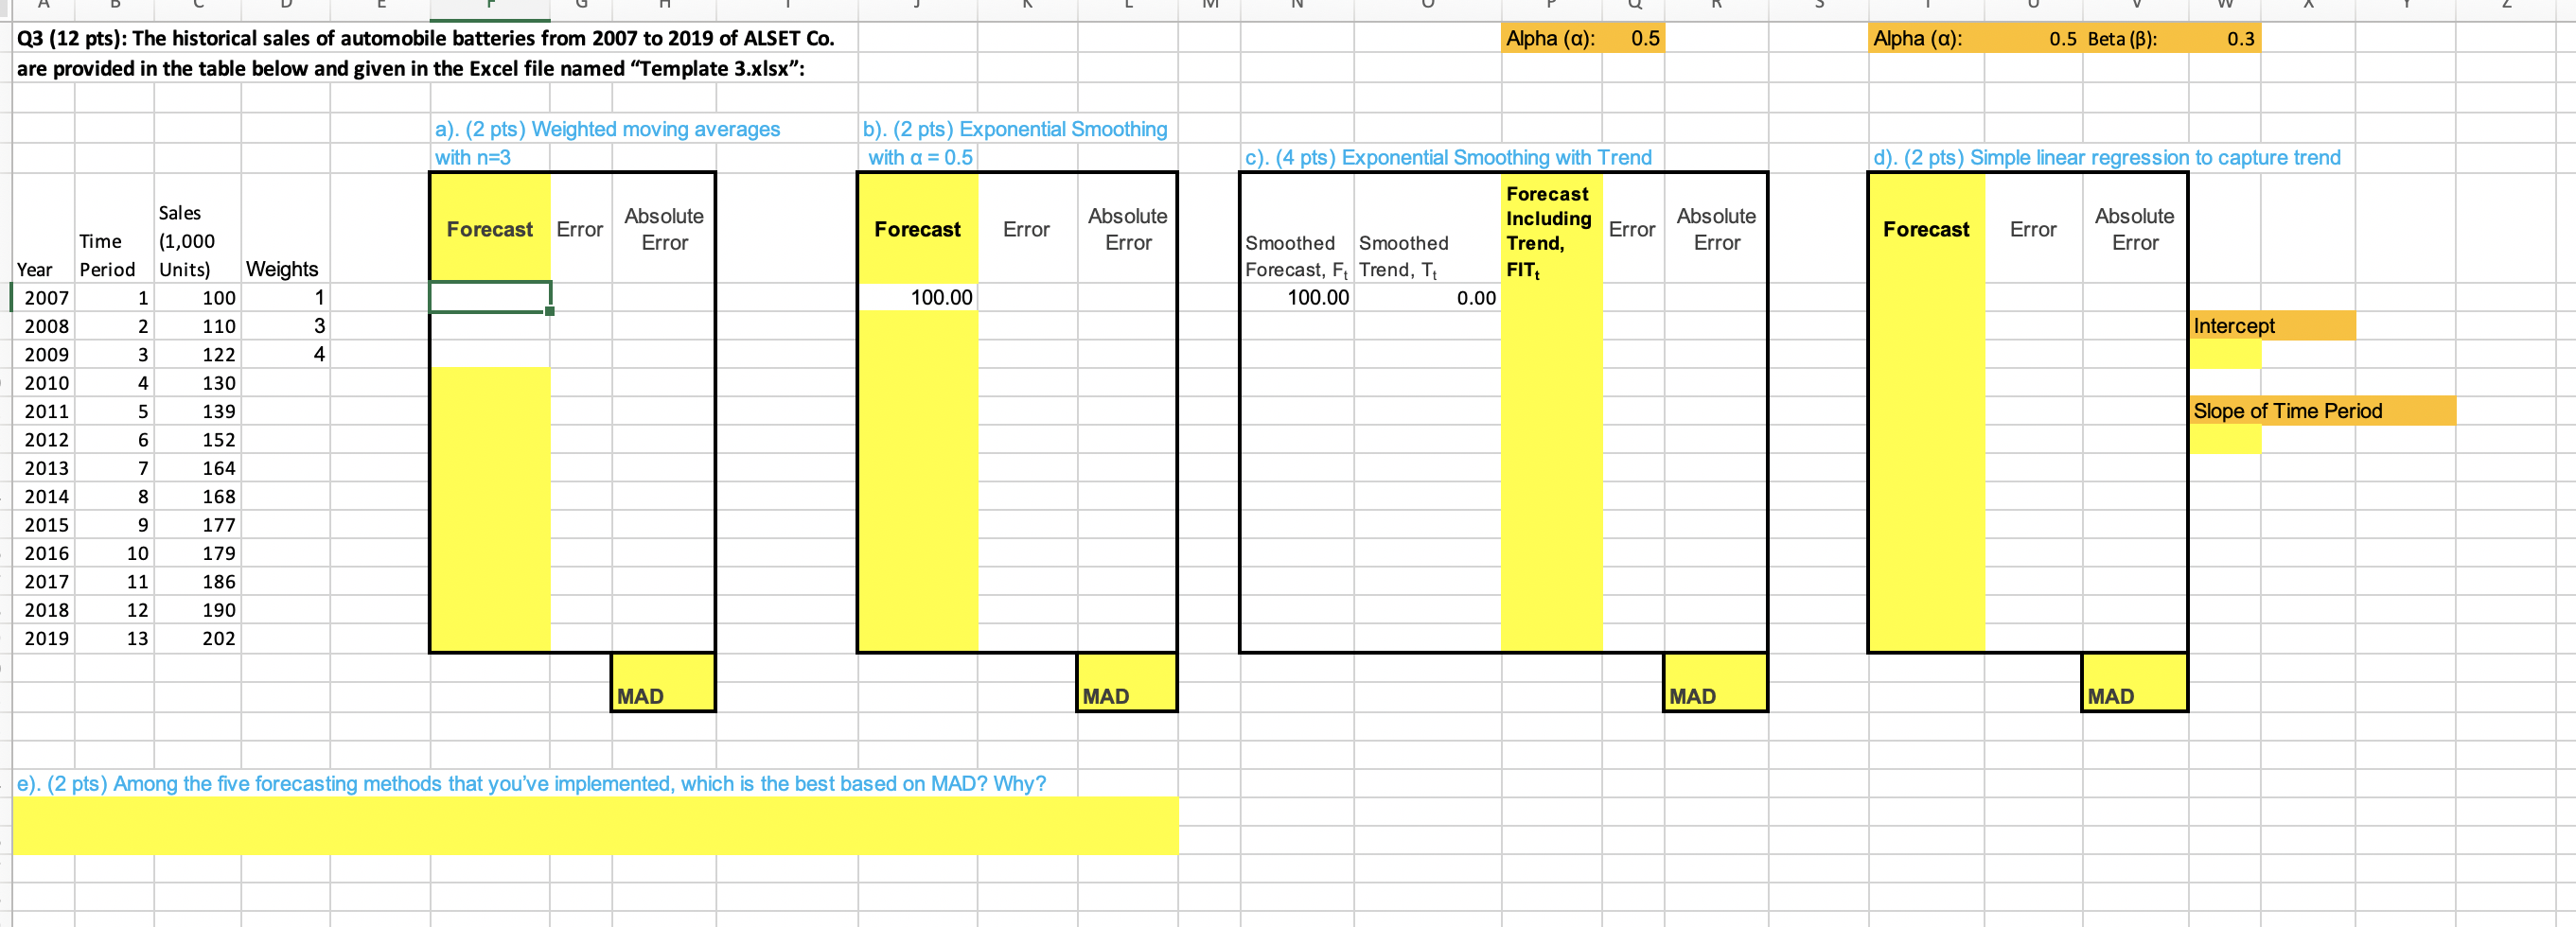
ALSET Co. intends to apply and compare a variety of forecasting methods using Excel in order to identify the best model to use.
- (2 pts) Calculate weighted moving averages forecasts with n=3 and calculate the MAD of the forecasts. The weights for the last period, two periods before, and three periods before are 4, 3, and 1, respectively (the weights are also provided in the Excel file named Template 3.xlsx). In your Excel file, please label the values clearly.
- (2 pts) Calculate exponential smoothing forecasts with the smoothing constant of 0.5 and calculate the MAD of the forecasts. Assume that the forecast for 2007 is the same as its actual sales (i.e., 100) and start your exponential smoothing forecasts from 2008. In your Excel file, please label the values clearly.
- (4 pts) Compute exponential smoothing with trend forecasts and calculate the MAD of the forecasts. Assume an initial smoothed forecast (Ft) of 100 and an initial smoothed trend (Tt) of 0 for 2007, use = 0.5 and = 0.3, and start your exponential smoothing with trend forecasts from 2008. In your Excel file, please label the values clearly.
- (2 pts) Develop a simple linear regression model to predict sales where the response variable is Sales and the predictor is the Time Period index. Use the estimated regression model to predict sales for each year from 2007 to 2019 and calculate the MAD of the forecasts. In your Excel file, please label the values clearly.
- (2 pts) Among the five forecasting methods that youve implemented, which is the best based on MAD? Why?
Step by Step Solution
There are 3 Steps involved in it
1 Expert Approved Answer
Step: 1 Unlock

Question Has Been Solved by an Expert!
Get step-by-step solutions from verified subject matter experts
Step: 2 Unlock
Step: 3 Unlock