

Question: Below are four bivariate data sets and the scatter plot for each. (Note that each scatter plot is displayed on the same scale.) Each data
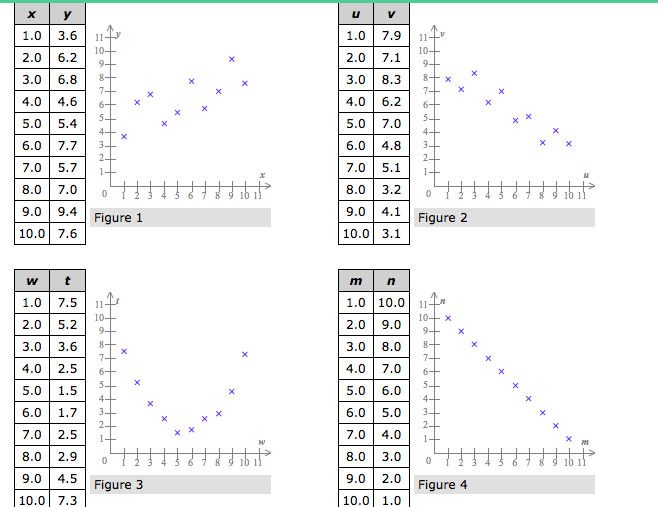
Below are four bivariate data sets and the scatter plot for each. (Note that each scatter plot is displayed on the same scale.) Each data set is made up of sample values drawn from a population.
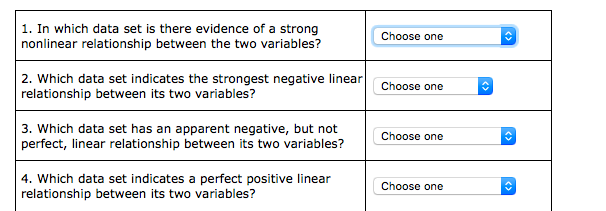
\f1. In which data set is there evidence of a strong nonlinear relationship between the two variables? Choose one 2. Which data set indicates the strongest negative linear relationship between its two variables? Choose one 3. Which data set has an apparent negative, but not perfect, linear relationship between its two variables? Choose one 4. Which data set indicates a perfect positive linear relationship between its two variables? Choose one
Step by Step Solution
There are 3 Steps involved in it
1 Expert Approved Answer
Step: 1 Unlock

Question Has Been Solved by an Expert!
Get step-by-step solutions from verified subject matter experts
Step: 2 Unlock
Step: 3 Unlock