

Below are log plots of porosity and resistivity for a reservoir interval between depths of 1725 and
Fantastic news! We've Found the answer you've been seeking!
Question:
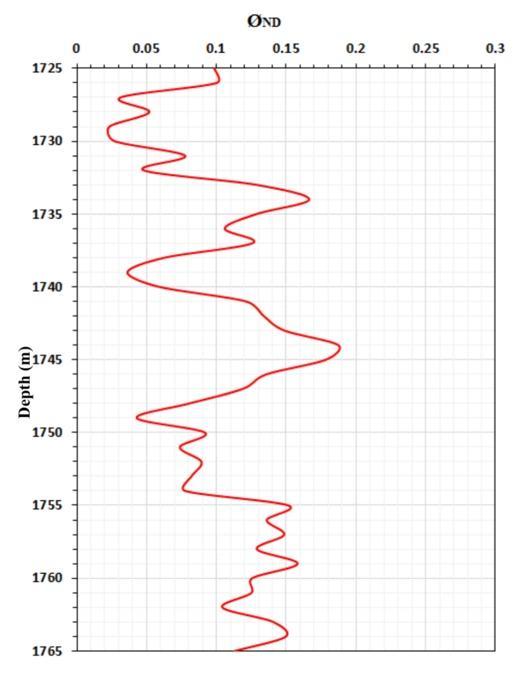
Below are log plots of porosity and resistivity for a reservoir interval between depths of 1725 and 1765m. Calculate water saturation in the uninvaded zone (Sw) and water saturation in the flushed zone (Sxo) using Archie’s equation for each 1.0m interval, then show (as curve lines vs. depth) the Sw, residual hydrocarbon saturation (Shr), and moveable hydrocarbon saturation (Shm) on the same track. Discuss the final result in detail.
Notes: Rw=0.05 ohm.m, Rmf=0.47 ohm.m, a=1.0, m=2.0, n=2.0. The well has been drilled with fresh water mud.
Expert Answer:

Related Book For 

Statistics For Business Decision Making And Analysis
ISBN: 9780321890269
2nd Edition
Authors: Robert Stine, Dean Foster
Posted Date:
