Below are monthly returns for the 4-week T-bill, the S&P 500 index, Duke Energy (DUK), Netflix (NFLX),
Fantastic news! We've Found the answer you've been seeking!
Question:
Below are monthly returns for the 4-week T-bill, the S&P 500 index, Duke Energy (DUK), Netflix (NFLX), Amazon.com (AMZN), and The Coca-Cola Company (KO). Use the monthly returns and Excel functions, formulas, and cell references to calculate the 1) monthly average return, 2) monthly standard deviation of returns, 3) the annualized average return using the EAR formula, and 4) the annualized risk premium. Format cells appropriately.
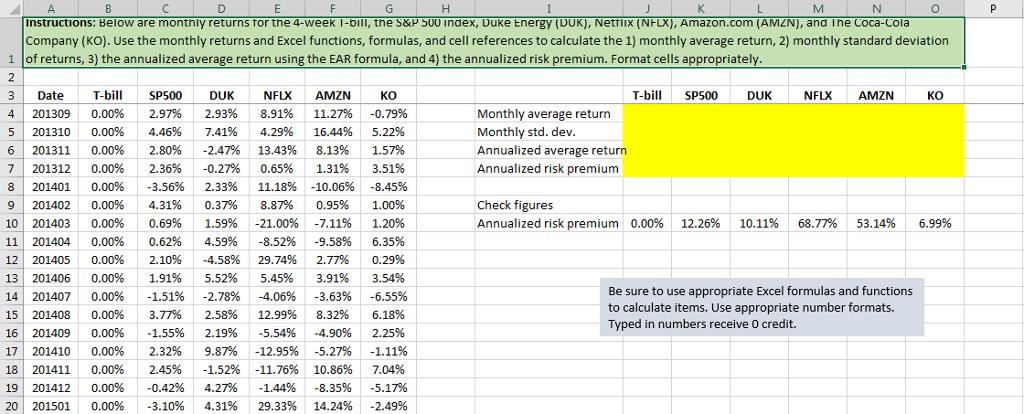
What formulas to use in order to get the Annualized risk premium.
Transcribed Image Text:
A B D E F M P Instructions: Below are monthly returns for the 4-week I-bill, the S&P 500 index, Duke Energy (DUK), Netflix (NFLX), Amazon.com (AMZN), and Ihe Coca-Cola Company (KO). Use the monthly returns and Excel functions, formulas, and cell references to calculate the 1) monthly average return, 2) monthly standard deviation 1 of returns, 3) the annualized average return using the EAR formula, and 4) the annualized risk premium. Format cells appropriately. 2 3 Date T-bill SP500 DUK NFLX AMZN ко T-bill SP500 DUK NFLX AMZN ко 201309 Monthly average return Monthly std. dev. Annualized average return 4 0.00% 2.97% 2.93% 8.91% 11.27% -0.79% 5 201310 6 201311 7 201312 8 201401 9 201402 10 201403 0.00% 4.46% 7.41% 4.29% 16.44% 5.22% 0.00% 2.80% -2.47% 13.43% 8.13% 1.57% 0.00% 2.36% -0.27% 0.65% 1.31% 3.51% Annualized risk premium 0.00% -3.56% 2.33% 11.18% -10.06% -8.45% 0.00% 4.31% 0.37% 8.87% 0.95% 1.00% Check figures 0.00% 0.69% 1.59% -21.00% -7.11% 1.20% Annualized risk premium 0.00% 12.26% 10.11% 68.77% 53.14% 6.99% 11 201404 12 201405 13 201406 14 201407 15 201408 16 201409 17 201410 18 201411 0.00% 0.62% 4.59% -8.52% -9.58% 6.35% 0.00% 2.10% -4.58% 29.74% 2.77% 0.29% 0.00% 1.91% 5.52% 5.45% 3.91% 3.54% Be sure to use appropriate Excel formulas and functions to calculate items. Use appropriate number formats. Typed in numbers receive O credit. 0.00% -1.51% -2.78% -4.06% -3.63% -6.55% 0.00% 3.77% 2.58% 12.99% 8.32% 6.18% 0.00% -1.55% 2.19% -5.54% -4.90% 2.25% 0.00% 2.32% 9.87% -12.95% -5.27% -1.11% 0.00% 2.45% -1.52% -11.76% 10.86% 7.04% 19 201412 0.00% -0.42% 4.27% -1.44% -8.35% -5.17% 20 201501 0.00% -3.10% 4.31% 29.33% 14.24% -2.49% A B D E F M P Instructions: Below are monthly returns for the 4-week I-bill, the S&P 500 index, Duke Energy (DUK), Netflix (NFLX), Amazon.com (AMZN), and Ihe Coca-Cola Company (KO). Use the monthly returns and Excel functions, formulas, and cell references to calculate the 1) monthly average return, 2) monthly standard deviation 1 of returns, 3) the annualized average return using the EAR formula, and 4) the annualized risk premium. Format cells appropriately. 2 3 Date T-bill SP500 DUK NFLX AMZN ко T-bill SP500 DUK NFLX AMZN ко 201309 Monthly average return Monthly std. dev. Annualized average return 4 0.00% 2.97% 2.93% 8.91% 11.27% -0.79% 5 201310 6 201311 7 201312 8 201401 9 201402 10 201403 0.00% 4.46% 7.41% 4.29% 16.44% 5.22% 0.00% 2.80% -2.47% 13.43% 8.13% 1.57% 0.00% 2.36% -0.27% 0.65% 1.31% 3.51% Annualized risk premium 0.00% -3.56% 2.33% 11.18% -10.06% -8.45% 0.00% 4.31% 0.37% 8.87% 0.95% 1.00% Check figures 0.00% 0.69% 1.59% -21.00% -7.11% 1.20% Annualized risk premium 0.00% 12.26% 10.11% 68.77% 53.14% 6.99% 11 201404 12 201405 13 201406 14 201407 15 201408 16 201409 17 201410 18 201411 0.00% 0.62% 4.59% -8.52% -9.58% 6.35% 0.00% 2.10% -4.58% 29.74% 2.77% 0.29% 0.00% 1.91% 5.52% 5.45% 3.91% 3.54% Be sure to use appropriate Excel formulas and functions to calculate items. Use appropriate number formats. Typed in numbers receive O credit. 0.00% -1.51% -2.78% -4.06% -3.63% -6.55% 0.00% 3.77% 2.58% 12.99% 8.32% 6.18% 0.00% -1.55% 2.19% -5.54% -4.90% 2.25% 0.00% 2.32% 9.87% -12.95% -5.27% -1.11% 0.00% 2.45% -1.52% -11.76% 10.86% 7.04% 19 201412 0.00% -0.42% 4.27% -1.44% -8.35% -5.17% 20 201501 0.00% -3.10% 4.31% 29.33% 14.24% -2.49%
Expert Answer:
Answer rating: 100% (QA)
Mnthly verge return fr Tbill vergeB4B20 Mnthly std dev fr TbillSTDE... View the full answer
Related Book For
Posted Date:
Students also viewed these finance questions
-
Monthly returns for the Toronto Stock Exchange Index and the following selected stocks on the Toronto Stock Exchange were recorded for the years 2011 to 2015: Barrick Gold (ABX) Bombardier (BBD.B)...
-
Duke Energy Corporation accounts for certain investments under the equity method, and as of December 31, 2008, Duke reported equity method investments of $473 million on its balance sheet and $696...
-
The average monthly cell phone bill was reported to be $50.07 by the U.S. Wireless Industry. Random sampling of a large cell phone company found the following monthly cell phone charges: At the 0.05...
-
For OEM & Aftermarket Parts Distribution Companies (reference an example company) Describe the sales presentation method: Salesperson to buyer? Salesperson to buyer to group? Sales team to buyer...
-
Should tax-loss carry forwards be booked? Explain.
-
Assume steady-state, one-dimensional heat conduction through the symmetric shape shown. Assuming that there is no internal heat generation, derive an expression for the thermal conductivity k(x) for...
-
Define the following: a. Asset b. Liability c. Net asset
-
A tabular analysis of the transactions made during August 2010 by Witten Company during its first month of operations is shown below. Each increase and decrease in stockholders equity is explained....
-
You are the COO managing the operations of a robo-advisor and you need to ensure that all the stock holdings in the portfolios under management are kept up to date. Given the following inputs in...
-
E-Z Loan, Co., makes loans to high-risk borrowers. E-Z borrows from its bank and then lends money to people with bad credit. The bank requires E-Z Loan to submit quarterly financial statements in...
-
Describe international business and globalization. Discuss the factors favoring exports from Dubai. Discuss the major export-import strategies of Dubai and its top ten exporters and importers note:
-
How much more would you earn in the first investment than in the second investment? $24,000 invested for 30 years at 12% compounded annually $24,000 invested for 30 years at 6% compounded annually...
-
How Policy is Made, Energy Politics, and Nevada. Pause after the "Energy Politics" section. I need to find a news article on an energy topic of interest to you. (Put a link to the article below)....
-
With it being financed and implemented under a PPP structure, how do macroeconomic conditions and toll rate issues serve to deter projects' investors and financiers?
-
what are the advantages or disadvantages of manufacturing and material location in the philippines
-
If $11,000 is invested in an account for 10 years. Find the value of the investment at the end of 10 years if the interest is: (a) 6% simple interest: $ (b) 6% compounded annually: $
-
What action can the Federal Reserve take to reduce unemployment? Using one of the tools available to the Federal Reserve, explain how the Fed would accomplish the action you listed. Assume the...
-
Which of the ocean zones shown would be home to each of the following organisms: lobster, coral, mussel, porpoise, and dragonfish? For those organisms you identify as living in the pelagic...
-
When the Dow-Jones Industrial Index increases it usually means that the economy is growing, which in turn usually means that the unemployment rate is low. A statistics professor pointed out that in...
-
Refer to Exercise 7.45. Compute the covariance and the coefficient of correlation. In exercise 7.45 The following table lists the bivariate distribution of X and Y . 2 .5 .1 .1 .3 2.
-
Repeat Exercise 15.1 with the following frequencies: In exercise 15.1 Consider a multinomial experiment involving n = 300 trials and k = 5 cells. The observed frequencies resulting from the...
-
Reconsider the data of Problem 31. Data from Problem 31 The following three investment opportunities are available. The returns for each investment for each year vary, but the first cost of each is...
-
The following three investment opportunities are available. The returns for each investment for each year vary, but the first cost of each is $20,000. Based on a future worth analysis, which...
-
Explain the relationship between the finite sample \(F\)-test and the large sample \(\chi^{2}\)-test, and the assumptions under which each is suitable.
Study smarter with the SolutionInn App