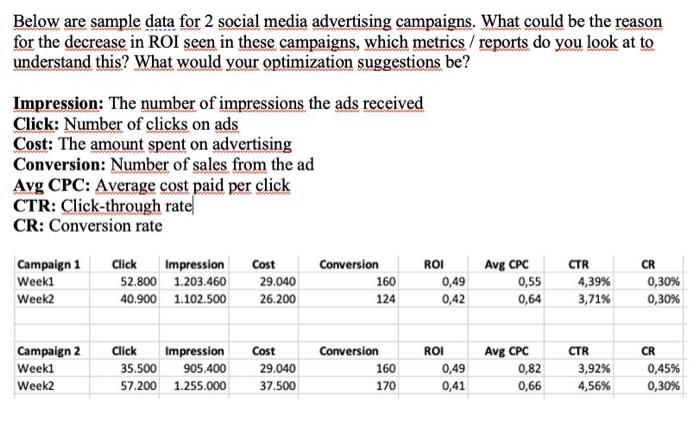
Question: Below are sample data for 2 social media advertising campaigns. What could be the reason for the decrease in ROI seen in these campaigns, which

Below are sample data for 2 social media
Below are sample data for 2 social media advertising campaigns. What could be the reason for the decrease in ROI seen in these campaigns, which metrics / reports do you look at to understand this? What would your optimization suggestions be? Impression: The number of impressions the ads received Click: Number of clicks on ads Cost: The amount spent on advertising Conversion: Number of sales from the ad Avg CPC: Average cost paid per click CTR: Click-through rate CR: Conversion rate Campaign 1 Weeki Week2 Click Impression 52.800 1.203.460 40.900 1.102.500 Cost 29.040 26.200 Conversion 160 ROI 0,49 0,42 Avg CPC 0,55 0,64 CTR 4,39% 3,71% CR 0,30% 0,30% 124 ROI CTR Campaign 2 Week1 Week2 Click 35.500 57.200 Impression 905.400 1.255.000 Cost 29.040 37.500 Conversion 160 170 0,49 0,41 Avg CPC 0,82 0,66 3,92% 4,56% CR 0,45% 0,30%

Step by Step Solution

There are 3 Steps involved in it

1 Expert Approved Answer
Step: 1 Unlock blur-text-image
Question Has Been Solved by an Expert!

Get step-by-step solutions from verified subject matter experts

Step: 2 Unlock
Step: 3 Unlock

Students Have Also Explored These Related General Management Questions!