

Question: Below are selected ratios provided for the current year for two companies in the fast food industry- Orange Ltd, and Green Ltd. : Orange Green
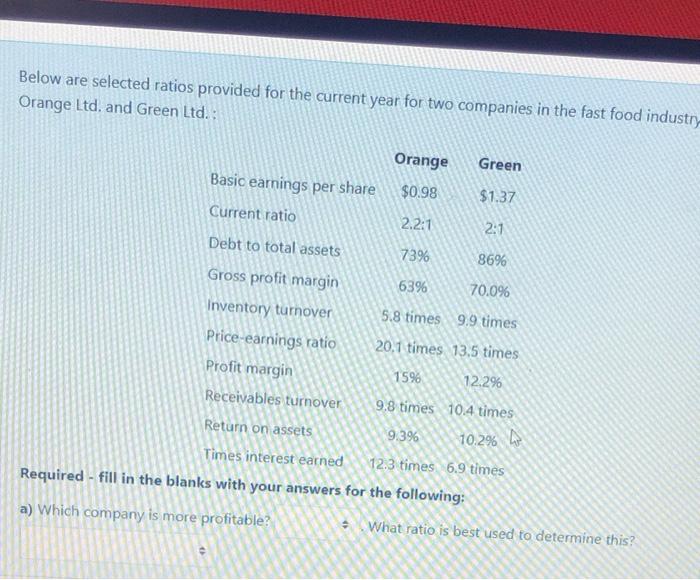
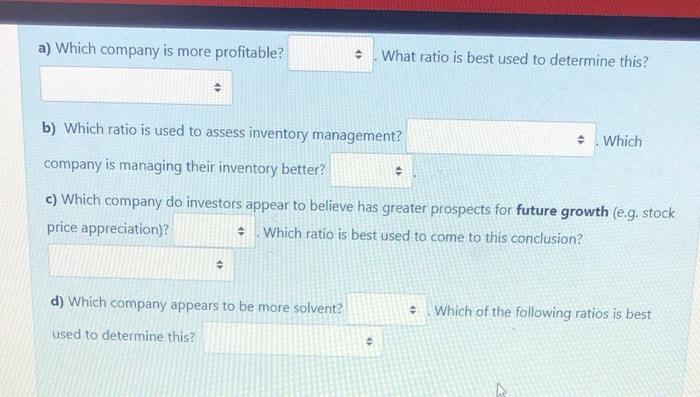
Below are selected ratios provided for the current year for two companies in the fast food industry- Orange Ltd, and Green Ltd. : Orange Green Basic earnings per share $0.98 $1.37 Current ratio 2.2:1 2:1 Debt to total assets 73% 8696 Gross profit margin 63% 70.0% Inventory tumover 5.8 times 9.9 times Price-earnings ratio 20.1 times 13.5 times Profit margin 1596 12.2% Receivables turnover 9.8 times 10.4 times Return on assets Times interest earned 12.3 times 6.9 times Required - fill in the blanks with your answers for the following: a) Which company is more profitable? What ratio is best used to determine this? 9.39 10.2% a) Which company is more profitable? What ratio is best used to determine this? b) Which ratio is used to assess inventory management? Which company is managing their inventory better? c) Which company do investors appear to believe has greater prospects for future growth (e.g. stock price appreciation)? Which ratio is best used to come to this conclusion? d) Which company appears to be more solvent? . Which of the following ratios is best used to determine this
Step by Step Solution
There are 3 Steps involved in it

Get step-by-step solutions from verified subject matter experts