Question: Below are the balance sheet statement, cash flow statement, and income statement of the company TD The Toronto-Dominion Bank. Based on this information, calculate the
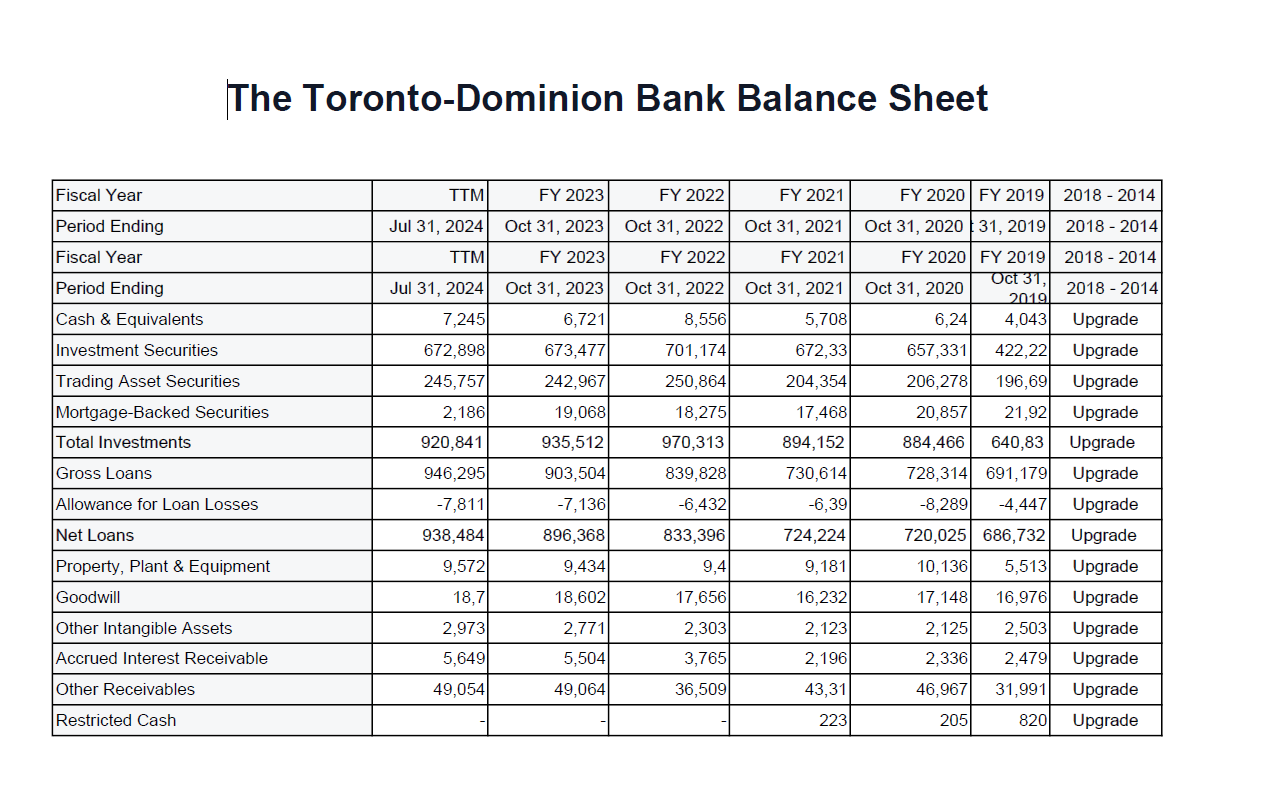
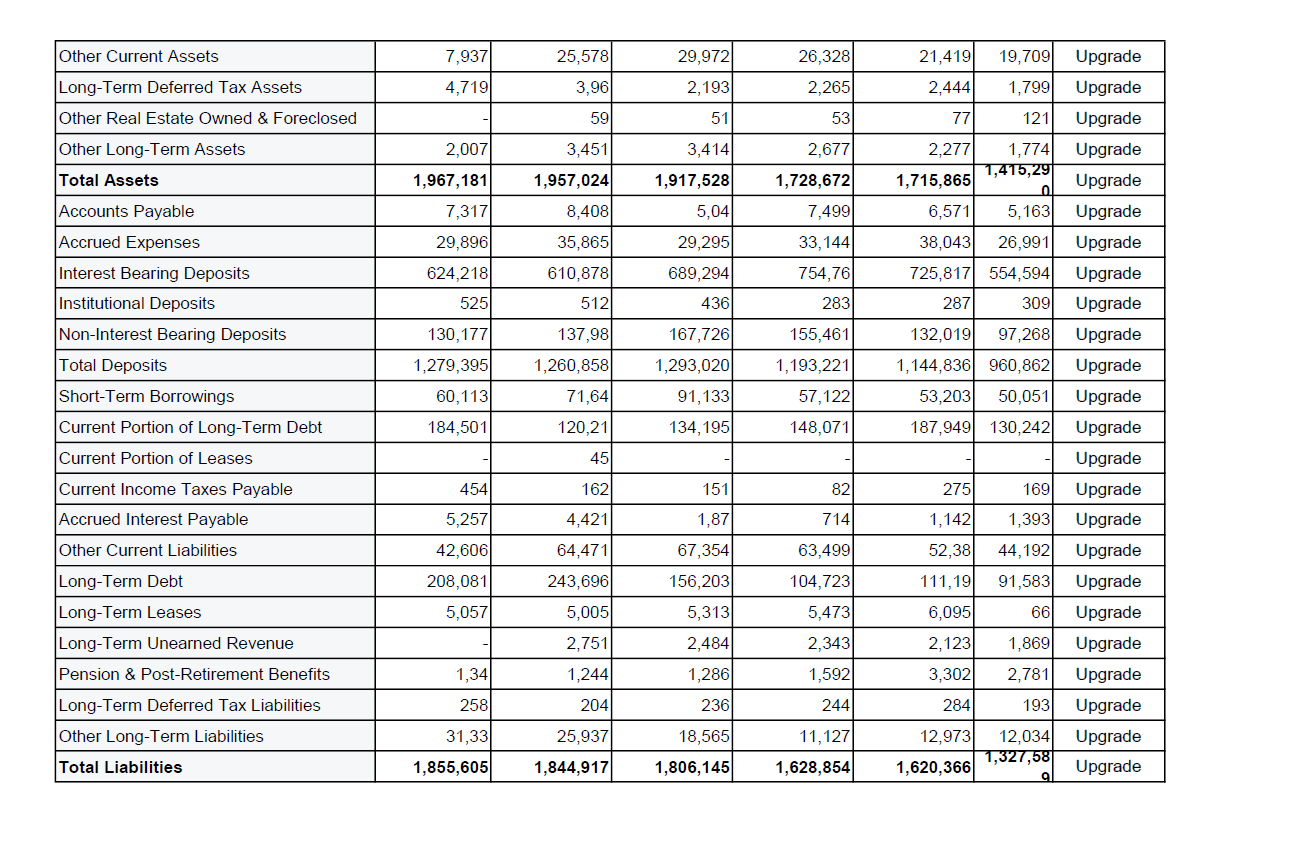
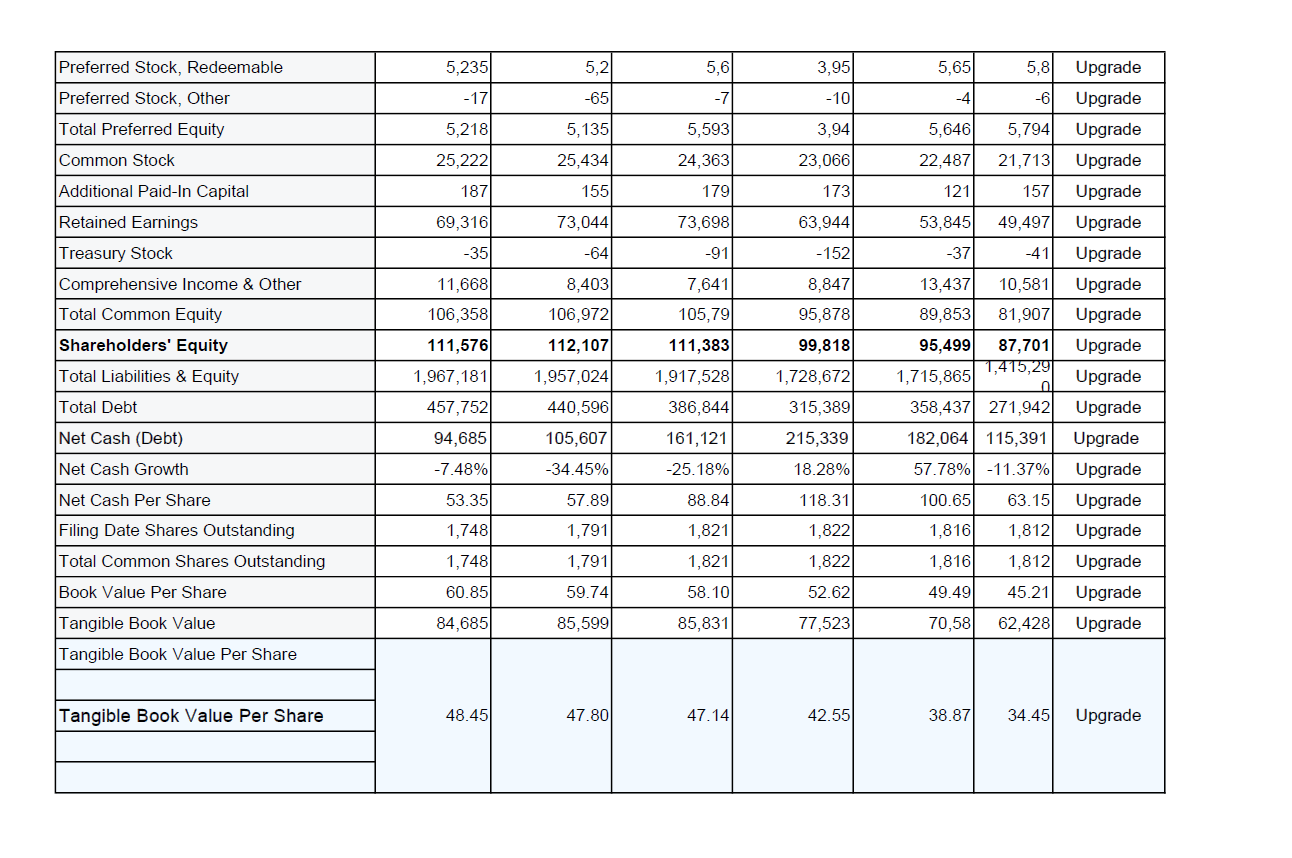
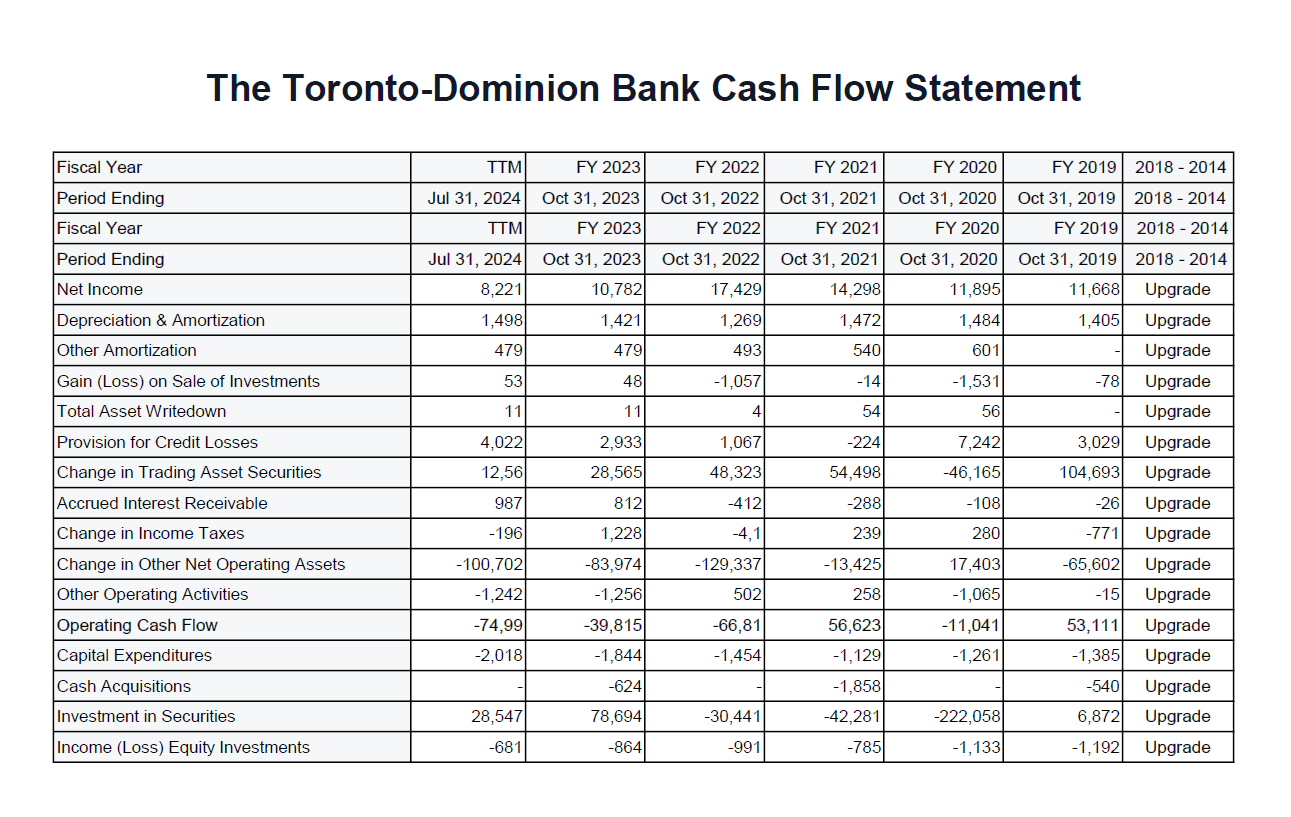
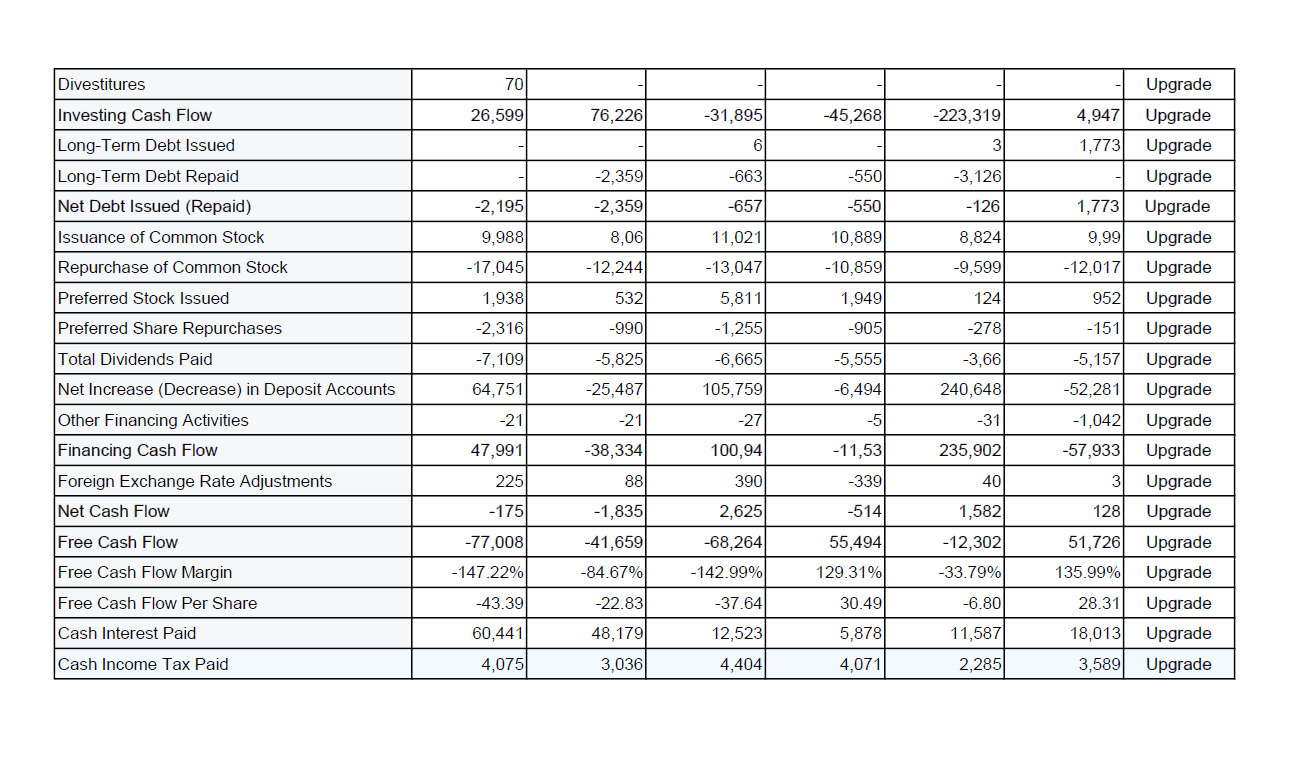
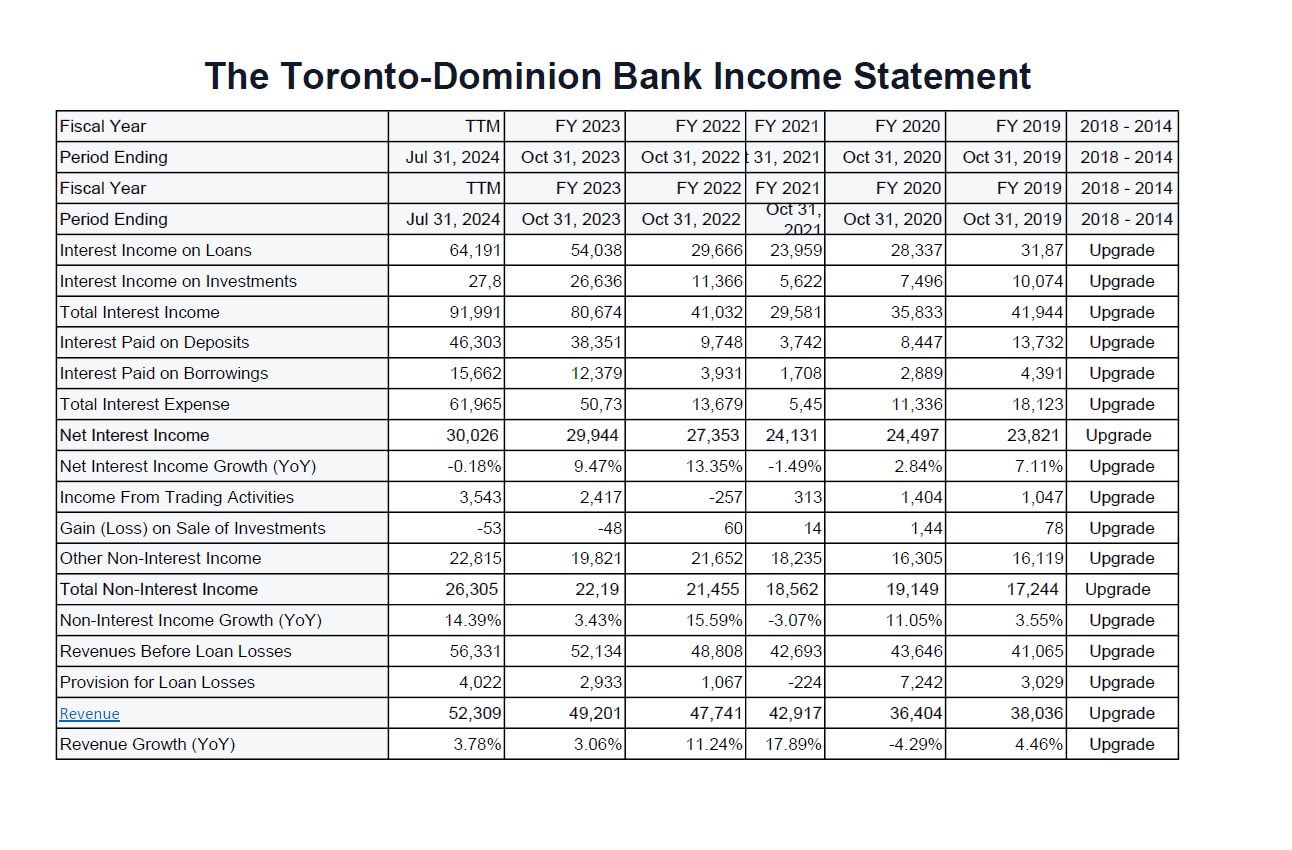
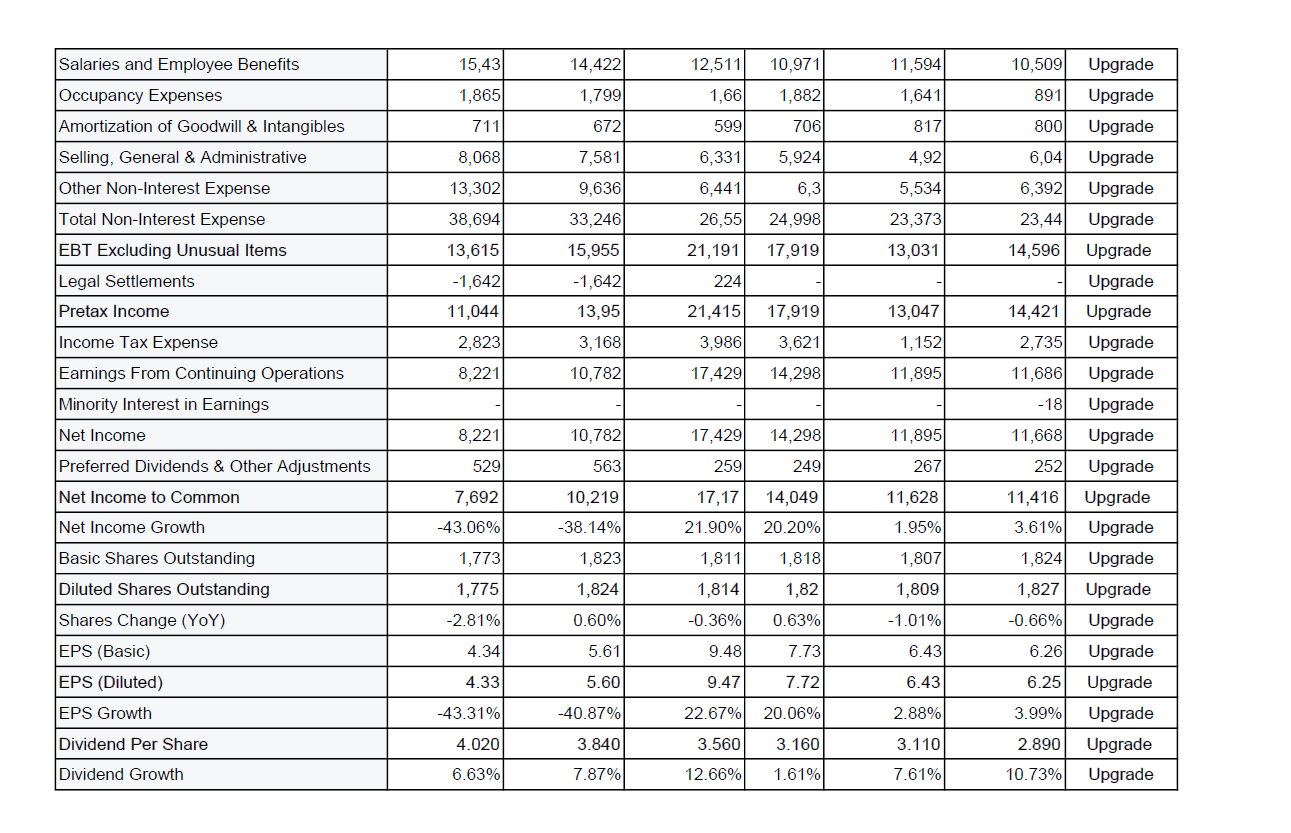
Below are the balance sheet statement, cash flow statement, and income statement of the company TD The Toronto-Dominion Bank. Based on this information, calculate the following ratios: Current ratio; Total asset turnover; Debt to equity; Times interest earned; Return on Equity for the years 2019 to 2023. Explain the ratios and what they mean for the company, as well as what factors may have contributed to variations over the years.
The Toronto-Dominion Bank Balance Sheet Fiscal Year TTM FY 2023 FY 2022 FY 2021 FY 2020 FY 2019 2018 - 2014 Period Ending Jul 31, 2024 Oct 31, 2023 Oct 31, 2022 Oct 31, 2021 Oct 31, 2020 31, 2019 2018 - 2014 Fiscal Year TTM FY 2023 FY 2022 FY 2021 FY 2020 FY 2019 2018 - 2014 Period Ending Jul 31, 2024 Oct 31, 2023 Oct 31, 2022 Oct 31, 2021 Oct 31, 2020 Oct 31, 2018 - 2014 2019 Cash & Equivalents 7,245 6,721 8,556 5,708 6,24 4,043 Upgrade Investment Securities 672,898 673,477 701, 174 672,33 657,331 422,22 Upgrade Trading Asset Securities 245,757 242,967 250,864 204,354 206,278 196,69 Upgrade Mortgage-Backed Securities 2,186 19,068 18,275 17,468 20,857 21,92 Upgrade Total Investments 920,841 935,512 970,313 894, 152 884,466 640,83 Upgrade Gross Loans 946,295 903,504 839,828 730,614 728,314 691, 179 Upgrade Allowance for Loan Losses -7,811 -7,136 -6,432 6,39 -8,289 -4,447 Upgrade Net Loans 938,484 896,368 833,396 724,224 720,025 686,732 Upgrade Property, Plant & Equipment 9,572 9,434 9,4 9, 181 10, 136 5,513 Upgrade Goodwill 18.7 18,602 17,656 16,232 17,148 16,976 Upgrade Other Intangible Assets 2,973 2,771 2,303 2,123 2, 125 2,503 Upgrade Accrued Interest Receivable 5,649 5,504 3,765 2, 196 2,336 2,479 Upgrade Other Receivables 49,054 49,064 36,509 43,31 46,967 31,991 Upgrade Restricted Cash 223 205 820 UpgradeOther Current Assets 7.937 25,578 29,972 26,328 21,419 19,709 Upgrade Long-Term Deferred Tax Assets 4,719 3,96 2,193 2,265 2,444 1,799 Upgrade Other Real Estate Owned & Foreclosed 59 51 53 77 121 Upgrade Other Long-Term Assets 2,007 3,451 3,414 2,677 2,277 1,774 Upgrade Total Assets 1,967, 181 1,957,024 1,917,528 1,728,672 1,715,865 1,415,29 Upgrade Accounts Payable 7,317 8,408 5,04 7,499 6,571 5,163 Upgrade Accrued Expenses 29,896 35.865 29,295 33, 144 38,043 26,991 Upgrade Interest Bearing Deposits 624,218 610,878 689,294 754,76 725,817 554,594 Upgrade Institutional Deposits 25 51 136 283 28 309 Upgrade Non-Interest Bearing Deposits 130,177 137,98 167,726 155,461 132,019 97,268 Upgrade Total Deposits 1,279,395 1,260,858 1,293,020 1, 193,221 1, 144,836 960,862 Upgrade Short-Term Borrowings 60, 113 71,64 91, 133 57,122 53,203 50,051 Upgrade Current Portion of Long-Term Debt 184,501 120,21 134,195 148,071 187,949 130,242 Upgrade Current Portion of Leases 45 Upgrade Current Income Taxes Payable 154 162 15 82 275 169 Upgrade Accrued Interest Payable 5,257 1,42 1,87 714 1,142 1,393 Upgrade Other Current Liabilities 42,606 64,471 67,354 63,499 52,38 44, 192 Upgrade Long-Term Debt 208,081 243,696 156,203 104,723 111, 19 91,583 Upgrade Long-Term Leases 5,057 5,005 5,313 5,473 6,095 66 Upgrade Long-Term Unearned Revenue 2,751 2,484 2,343 2,123 1,869 Upgrade Pension & Post-Retirement Benefits 1,34 1,244 1,286 1,592 3,302 2,781 Upgrade Long-Term Deferred Tax Liabilities 258 204 236 244 284 193 Upgrade Other Long-Term Liabilities 31,33 25,937 18,565 11,127 12,973 12,034 Upgrade Total Liabilities 1,855,605 1,844,917 1,806,145 1,628,854 1,620,366 1,327,58 UpgradePreferred Stock, Redeemable Preferred Stock, Other Upgrade Total Preferred Equity 2 . , Upgrade Common Stock i ; ) Upgrade Additional Paid-In Capital Upgrade Retained Earnings 3 . | , 53,845 49497 Upgrade Treasury Stock -152 Shareholders' Equity 112,107 111,383 95,499 Upgrade Total Liabilities & Equity 1,967,181 1,957,024 1,917,528 1,715,865 " 77 Upgrade Total Debt 457,752 440,596 386,844 358,437 Upgrade Net Cash (Debt) 94,685 105,607 161,121 182,064 | 115,391| Upgrade Net Cash Growth -7.48% -34.45% -25.18% -11.37%| Upgrade Net Cash Per Share 57.89 88.84 118.31 10065 63.15| Upgrade Filing Date Shares Outstanding 1,748 1,791 1,821 1,822 1,816 1,812 Upgrade Total Commeon Shares Qutstanding s 1,791 , 1,816 .81 Upgrade Book Value Per Share a 5974 . . Upgrade Tangible Book Value , 85,599 , , , Upgrade Tangible Book Value Per Share Tangible Book Value Per Share Upgrade The Toronto-Dominion Bank Cash Flow Statement Fiscal Year TTM FY 2023 FY 2022 FY 2021 FY 2020 FY 2019 2018 - 2014 Period Ending Jul 31, 2024 Oct 31, 2023 Oct 31, 2022 Oct 31, 2021 Oct 31, 2020 Oct 31, 2019 2018 - 2014 Fiscal Year TTM FY 2023 FY 2022 FY 2021 FY 2020 FY 2019 2018 - 2014 Period Ending Jul 31, 2024 Oct 31, 2023 Oct 31, 2022 Oct 31, 2021 Oct 31, 2020 Oct 31, 2019 2018 - 2014 Net Income 8.221 10,782 17.429 14,298 11,895 11,668 Upgrade Depreciation & Amortization 1,498 1,421 1,269 1,472 1,484 1,405 Upgrade Other Amortization 479 179 193 540 601 Upgrade Gain (Loss) on Sale of Investments 53 48 1,057 14 -1,531 78 Upgrade Total Asset Writedown 11 11 4 54 56 Upgrade Provision for Credit Losses 4,022 2,933 1,067 224 7,242 3.029 Upgrade Change in Trading Asset Securities 12.56 28,565 48,323 54,498 -46,165 104,693 Upgrade Accrued Interest Receivable 987 312 412 288 108 26 Upgrade Change in Income Taxes -196 1,228 4,1 239 280 771 Upgrade Change in Other Net Operating Assets -100,702 -83,974 -129,337 -13,425 17,403 65,602 Upgrade Other Operating Activities -1,242 -1,256 502 258 -1,065 15 Upgrade Operating Cash Flow 74,99 -39,815 -66,81 56,623 -11,041 53, 111 Upgrade Capital Expenditures 2,018 1,844 1,454 1,129 1,261 1,385 Upgrade Cash Acquisitions 624 -1,858 540 Upgrade Investment in Securities 28,547 78,694 30,441 -42,281 222,058 6,872 Upgrade Income (Loss) Equity Investments -681 -864 -991 -785 -1,133 -1, 192 UpgradeDivestitures 70 - - - - -| Upgrade Investing Cash Flow 26,599 76,226 4,947 Upgrade Long-Term Debt Issued - - 6 - 3 1,773] Upgrade Long-Term Debt Repaid - -2,359 -3,126 -| Upgrade Net Debt Issued (Repaid) -2,195 -2,359 -657 -550 -126 1,773| Upgrade Issuance of Common Stock 0,988 8,06 11,021 10,889 999] Upgrade Repurchase of Common Stock -17,045 -12,244 -13,047 -10,859 -9,599 -12,017] Upgrade Preferred Stock Issued 1,938 532 5,811 1.949 124 952| Upgrade Preferred Share Repurchases -2,316 -990 -1,255 -905 -278 -151| Upgrade Total Dividends Paid -7,109 -5.825 6,665 -5,955 -5157| Upgrade Net Increase (Decrease) in Deposit Accounts 64,751 -25 487 105,759 -6,494 240,648 -52.281] Upgrade Other Financing Activities -21 -21 27 5 -31 -1042| Upgrade Financing Cash Flow 47,991 -38,334 100,94 -11,53 235,902 -57,933| Upgrade Foreign Exchange Rate Adjustments 225 88 390 -339 40 3| Upgrade Net Cash Flow -175 -1,835 2,625 -514 1,582 128| Upgrade Free Cash Flow -77,008 -41,659 -68,264 55,494 51,726/ Upgrade Free Cash Flow Margin -147.22% -142.99% -33.79% 135.99%| Upgrade Free Cash Flow Per Share -43.39 -6.80 2831 Upgrade Cash Interest Paid 60,441 48,179 12,523 5,878 11,587 18,013| Upgrade Cash Income Tax Paid 4075 3,036 4 404 4071 2,285 3,589| Upgrade 2 The Toronto-Dominion Bank Income Statement Fiscal Year TTM FY 2023 FY 2022 FY 2021 FY 2020 FY 2019 2018 - 2014 Period Ending Jul 31, 2024 Oct 31, 2023 Oct 31, 2022 | 31, 2021 Oct 31, 2020 Oct 31, 2019 2018 - 2014 Fiscal Year TTM FY 2023 FY 2022 FY 2021 FY 2020 FY 2019 2018 - 2014 Oct 31, Period Ending Jul 31, 2024 Oct 31, 2023 Oct 31, 2022 Oct 31, 2020 Oct 31, 2019 2018 - 2014 2021 st Income on Loans 64, 191 54,038 29,66 23,959 28,337 31,87 Upgrade Interest Income on Investments 27,8 26,636 11,366 5,622 7,496 10,074 Upgrade Total Interest Income 91,991 80,674 41,032 29,581 35,833 41,944 Upgrade Interest Paid on Deposits 46,303 38.351 9,748 3,742 8,447 13,732 Upgrade Interest Paid on Borrowings 15,662 12,379 3,931 1,708 2,889 4,39 Upgrade Total Interest Expense 61,965 50,73 13,679 5,45 11,336 18,123 Upgrade Net Interest Income 30,026 29,944 27,353 24, 131 24,497 23,821 Upgrade Net Interest Income Growth (YoY) 0. 18% 9.47% 13.35% -1.49% 2.84% 7.11% Upgrade Income From Trading Activities 3,543 2,417 25 313 1,404 1,047 Upgrade Gain (Loss) on Sale of Investments 53 18 60 14 1,44 78 Upgrade Other Non-Interest Income 22,815 19,821 21,652 18,235 16,305 16, 119 Upgrade Total Non-Interest Income 26,305 22, 19 21,455 18,562 19,149 17,244 Upgrade Non-Interest Income Growth (YoY) 14.39% 3.43% 15.59% -3.07% 11.05% 3.55% Upgrade Revenues Before Loan Losses 56.331 52,134 48,808 42,693 43,646 41,065 Upgrade Provision for Loan Losses 4,022 2,933 1,067 224 7,242 3,029 Upgrade Revenue 52,309 49,201 47,741 42,917 36,404 38,036 Upgrade Revenue Growth (YoY) 3.78% 3.06% 11.24% 17.89% -4.29% 4.46% UpgradeSalaries and Employee Benefits 15,43 14, 422 11,504 10,509 Upgrade Occupancy Expenses 1,865 1,641 891 Upgrade Amortization of Goodwill & Intangibles 711 817 800 Upgrade Selling, General & Administrative 8,068 492 6,04 Upgrade Other Non-Interest Expense 13,302 5,534 6,392 Upgrade Total Non-Interest Expense 38,694 23,373 23,44| Upgrade EBT Excluding Unusual ltems 13,615 15,955 13,031 14,596| Upgrade Legal Settlements -1,642 -1, b42 - -| Upgrade Pretax Income 11,044 13,95 13,047 14,421| Upgrade Income Tax Expense 2,823 3,986 1,152 2735 Upgrade Earnings From Continuing Operations 8,221 17,429 11,895 11,686| Upgrade Minority Interest in Earnings - - - -18| Upgrade Net Income 8,221 17,429 11,895 11,668| Upgrade Preferred Dividends & Other Adjustments 529 267 252 Upgrade Net Income to Common 7,692 10,219 11,628 11,416 Upgrade Net Income Growth -43.06% -38.14% 1.95% 3.61%| Upgrade Basic Shares Outstanding 1,773 1,823 1,807 1,824 Upgrade Diluted Shares Outstanding 1,775 1,824 1,809 1,827 | Upgrade Shares Change (YoY) -2.81% 0.60% -1.01% -0.66%| Upgrade EPS (Basic) 4.34 5.61 6.43 6.26| Upgrade EPS (Diluted) 433 5.60 6.43 6.25| Upgrade EPS Growth 43.31% 40.67% 2.88% 3.99%| Upgrade Dividend Per Share 4.020 3.840 3110 2800| Upgrade Dividend Growth 6.63% 7.87% 12.66% 7.61% 10.73%| Upgrade
Step by Step Solution
There are 3 Steps involved in it
1 Expert Approved Answer
Step: 1 Unlock
Question Has Been Solved by an Expert!
Get step-by-step solutions from verified subject matter experts
Step: 2 Unlock
Step: 3 Unlock
Students Have Also Explored These Related Accounting Questions!