

Question: Below are the questions used previously for problem 2 + 2 new questions for problem 3. Please keep also in mind you should also create
Below are the questions used previously for problem 2 + 2 new questions for problem 3. Please keep also in mind you should also create a copy of your worksheet to use as a template as explained above.
* Please provide screenshots pictures of your excel computations. For all questions. That's extremely important !!!
Thanks
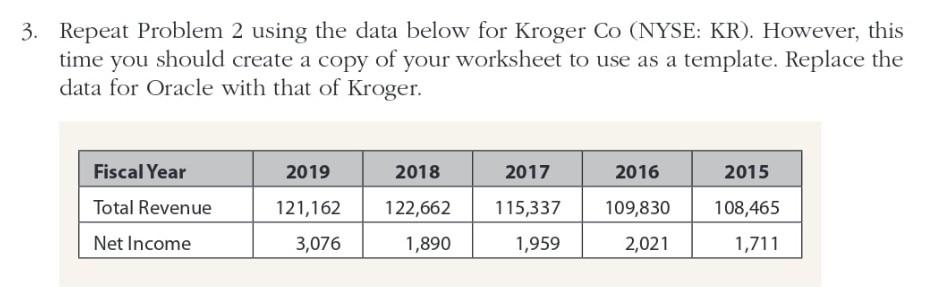
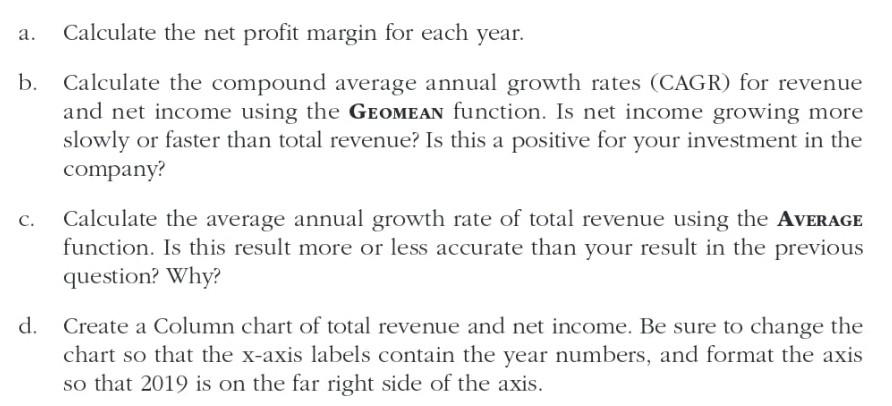
Repeat Problem 2 using the data below for Kroger Co (NYSE: KR). However, this time you should create a copy of your worksheet to use as a template. Replace the data for Oracle with that of Kroger. a. Calculate the net profit margin for each year. b. Calculate the compound average annual growth rates (CAGR) for revenue and net income using the GEOmEan function. Is net income growing more slowly or faster than total revenue? Is this a positive for your investment in the company? c. Calculate the average annual growth rate of total revenue using the AvEraGE function. Is this result more or less accurate than your result in the previous question? Why? d. Create a Column chart of total revenue and net income. Be sure to change the chart so that the x-axis labels contain the year numbers, and format the axis so that 2019 is on the far right side of the axis. a. Which company's sales were growing faster over this period? Which one had the faster net income growth? b. Which company was more profitable in 2019? Which was more profitable if you take a longer view? Would the volatility of the net profit margin affect your desire to invest in one company or the other
Step by Step Solution
There are 3 Steps involved in it

Get step-by-step solutions from verified subject matter experts