

Question: Below are the results of Multiple Regression Analysis. Write down the interpretation of the following tables: Model Summary Change Statistics R Adjusted R Std. Error

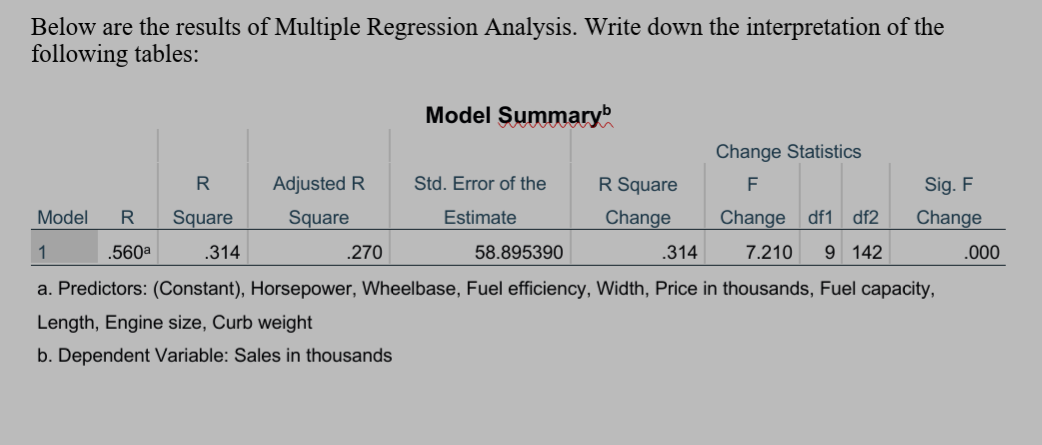
Below are the results of Multiple Regression Analysis. Write down the interpretation of the following tables: Model Summary Change Statistics R Adjusted R Std. Error of the R Square F Sig. F Model R Square Square Estimate Change Change df1 df2 Change .560a 314 .270 58.895390 .314 7.210 9 142 000 a. Predictors: (Constant), Horsepower, Wheelbase, Fuel efficiency, Width, Price in thousands, Fuel capacity, Length, Engine size, Curb weight b. Dependent Variable: Sales in thousands
Step by Step Solution
There are 3 Steps involved in it
1 Expert Approved Answer
Step: 1 Unlock

Question Has Been Solved by an Expert!
Get step-by-step solutions from verified subject matter experts
Step: 2 Unlock
Step: 3 Unlock