

Question: Below are the substituted instructions and requirements for 'Project #2: Triangulation'. As you should have seen, I posted an explanation about the original assignment that
Below are the substituted instructions and requirements for 'Project #2: Triangulation'. As you should have seen, I posted an explanation about the original assignment that should clarify some of the confusion. And, it may be helpful in completing the revised assignment.
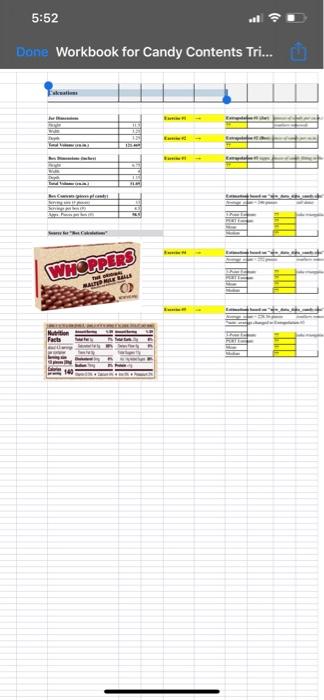
The attached workbook (Excel spreadsheet) contains various information about the data and calculations needed for this assignment. For future reference, I find it easier to use simpler terms when describing to team members what type of information may be needed. A case in point:
- Triangulation can be easier communicated as a 3-point estimate: (Most Optimistic # + Most Likely# + Most Pessimistic #) / 3 - PERT can be easier communicated as a weighted estimate: (Most Optimistic # + (Most Likely # x 4) + Most Pessimistic #) / 6
It's important to know terminology and definitions, but more important to communicate clearly and make sure the everyone understands what's being requested.
INSTRUCTIONS
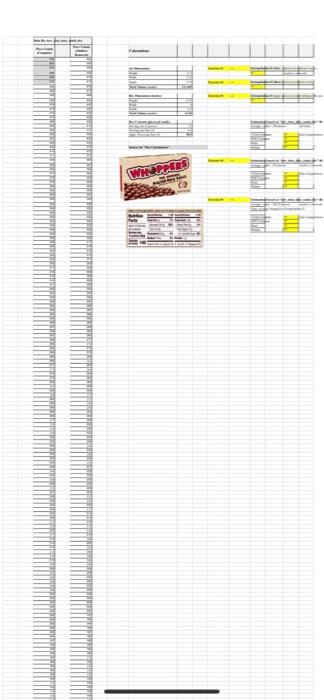
- Two views of the data file are provided: total data points, and data points with the 'outliers' removed. An outlier is a statistical observation that is markedly different in value from the others of the sample. Values that are outliers give disproportionate weight to larger over smaller values, or to values that are substantially outside of the typical values/distribution of data.
- Your assignment is to complete the calculations shown for Exercise #1 through Exercise #6. All of these exercises can be completed using basic math equations, formulas defined above, and pre-built formula functions provided in the Excel worksheet.
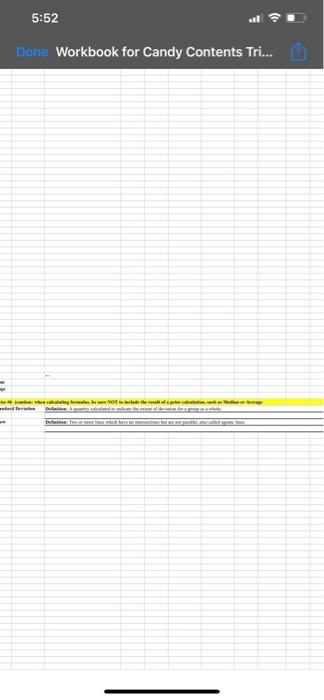
- All original required data statistics need to be calculated, including data average, data mean, data median, standard deviation, skewness and kurtosis.
- For Exercise #6, also answer the two definition questions (some simple research or watching the related video should be all that's needed).
- To assist you and make up for some 'lost time', information has been calculated for you and is in the spreadsheet, including:
- Average based on the datasets displayed in the Excel spreadsheet
- How much candy fits in a jar given the size of the jar and the candy
- Candy volume/count estimates based on a box of the candy
- Size of the box and number of candies in the box
- How many candies will fit in the jar based on (A.) above
- You do not need to write any papers or other materials for this revised assignment; just complete the attached Excel workbook.
Step by Step Solution
There are 3 Steps involved in it

Get step-by-step solutions from verified subject matter experts