

Below are three Bloomberg yield tables for a Fannie Mae 30-year MBS under three different prices...
Fantastic news! We've Found the answer you've been seeking!
Question:
Transcribed Image Text:
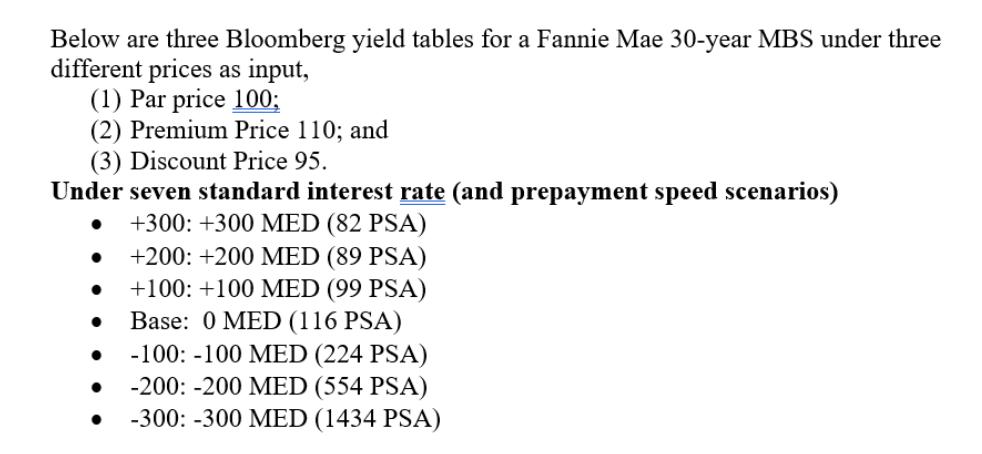
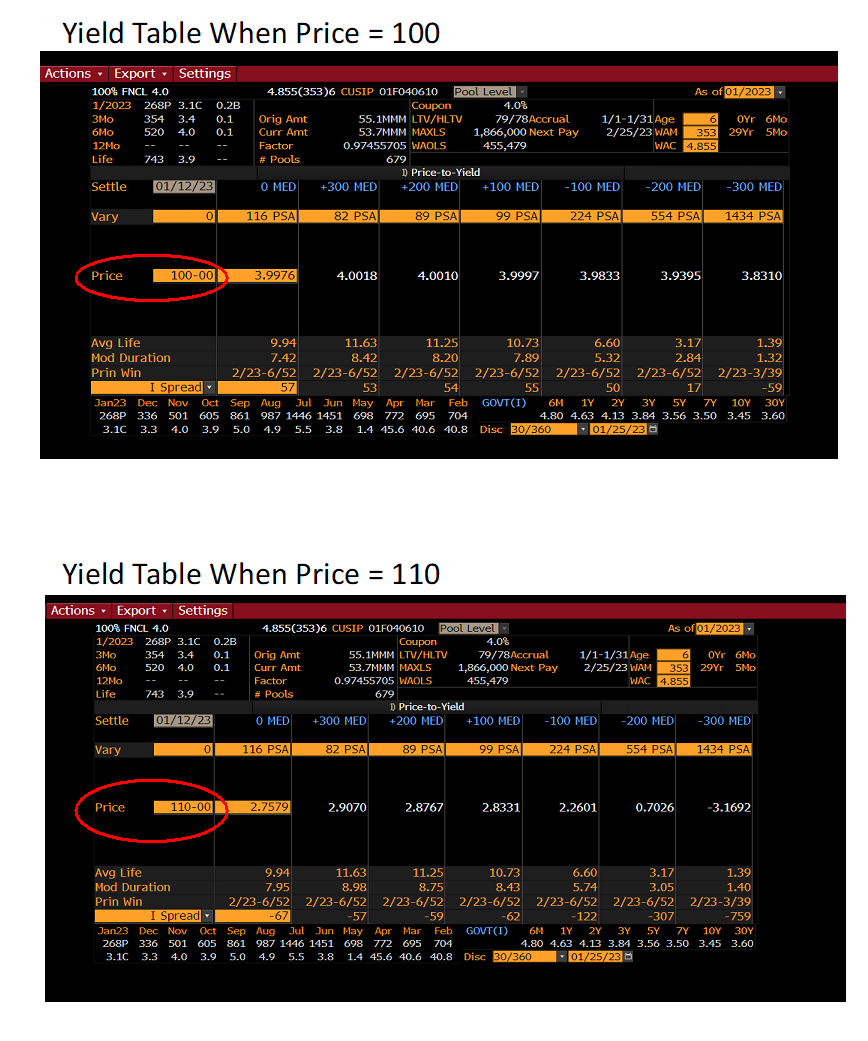
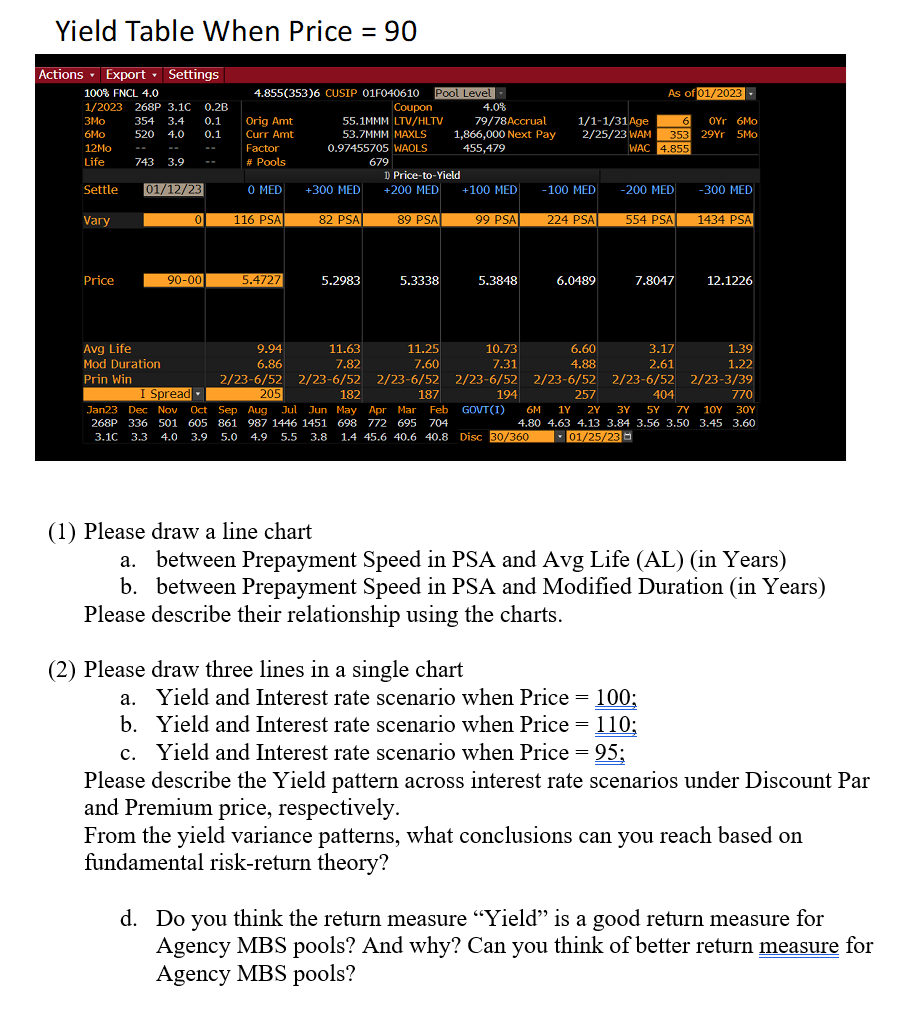
Below are three Bloomberg yield tables for a Fannie Mae 30-year MBS under three different prices as input, (1) Par price 100; (2) Premium Price 110; and (3) Discount Price 95. Under seven standard interest rate (and prepayment speed scenarios) +300: +300 MED (82 PSA) +200: +200 MED (89 PSA) +100: +100 MED (99 PSA) Base: 0 MED (116 PSA) -100: -100 MED (224 PSA) -200: -200 MED (554 PSA) -300: -300 MED (1434 PSA) Yield Table When Price = 100 Actions Export Settings 100% FNCL 4.0 1/2023 268P 3.1 0.2B 354 3.4 0.1 520 4.0 0.1 3Mo 6Mo 12Mo Life Settle Vary Price 3Mo 6Mo -- Avg Life Mod Duration Prin Win 12Mo Life Settle Vary 743 3.9 Price -- 01/12/23 100-00 0 -- 743 3.9 Avg Life Mod Duration Prin Win Y 01/12/23 -- 0 110-00 4.855(353)6 CUSIP 01F040610 Pool Level Coupon Orig Amt Curr Amt 55.1MMM LTV/HLTV 53.7MMM MAXLS 0.97455705 WAOLS 679 Factor # Pools -- O MED 116 PSA 3.9976 Yield Table When Price = 110 Actions Export Settings 100% FNCL 4.0 1/2023 268P 3.10 0.2B 354 3.4 0.1 520 4.0 0.1 9.94 7.42 2/23-6/52 I Spread 57 53 54 Jan23 Dec Nov Oct Sep Aug Jul Jun May Apr Mar Feb 268P 336 501 605 861 1446 1451 861 987 1446 1451 698 772 695 704 3.1C 3.3 4.0 3.9 5.0 987 4.9 5.5 3.8 1.4 45.6 40.6 40.8 1.4 45.6 40.6 40.8 Disc 30/360 Orig Amt Curr Amt Factor # Pools +300 MED O MED 82 PSA 116 PSA 4.0018 2.7579 11.63 8.42 2/23-6/52 2/23-6/52 D) Price-to-Yield +200 MED 89 PSA 4.0010 +300 MED 11.25 8.20 4.855(353)6 CUSIP 01F040610 Pool Level 82 PSA 2.9070 Coupon 55.1MMM LTV/HLTV 53.7MMM MAXLS 0.97455705 WAOLS 679 4.0% 79/78Accrual 1,866,000 Next Pay 455,479 1) Price-to-Yield +200 MED 89 PSA +100 MED 2.8767 99 PSA 3.9997 4.0% 79/78Accrual 1,866,000 Next Pay 455,479 +100 MED 99 PSA 2.8331 -100 MED 224 PSA 1/1-1/31Age 2/25/23 WAM 3.9833 -100 MED 224 PSA 10.73 6.60 3.17 1.39 2.84 7.89 5.32 1.32 2/23-6/52 2/23-6/52 2/23-6/52 2/23-3/39 55 50 17 -59 GOVT (1) 6M 1Y 2Y 3Y 5Y 74 10Y 30Y 4.80 4.63 4.13 3.84 3.56 3.50 3.45 3.60 01/25/23 2.2601 WAC 4.855 As of 01/2023 -200 MED 6 OYr 6Mo 353 29Yr 5Mo 554 PSA 3.9395 -200 MED As of 01/2023 1/1-1/31 Age 6 0Yr 6Mo 2/25/23 WAM 353 29Yr 5Mo WAC 4.855 554 PSA 0.7026 -300 MED 1434 PSA 3.8310 -300 MED 1434 PSA -3.1692 9.94 11.63 11.25 10.73 6.60 1.39 3.17 7.95 8.98 8.75 8.43 5.74 3.05 1.40 2/23-6/52 2/23-6/52 2/23-6/52 2/23-6/52 2/23-6/52 2/23-6/52 2/23-3/39 I Spread -67 -57 -59 -62 -122 -307 -759 Jan23 Dec Nov Oct Sep Aug Jul Jun May Apr Mar Feb GOVT(I) 6M 1Y 2Y 3Y 5Y 7Y 10Y 30Y 268P 336 501 605 861 987 1446 1451 698 772 695 704 4.80 4.63 4.13 3.84 3.56 3.50 3.45 3.60 3.1C 3.3 4.0 3.9 5.0 4.9 5.5 3.8 1.4 45.6 40.6 40.8 Disc 30/360 01/25/23 Yield Table When Price = 90 Actions Export Settings 100% FNCL 4.0 1/2023 268P 3.1C 0.2B 3Mo 354 3.4 0.1 6Mo 12Mo 520 4.0 0.1 Life Settle Vary Price -- 743 3.9 01/12/23 Avg Life Mod Duration Prin Win 0 90-00 4.855(353)6 CUSIP 01F040610 Pool Level Coupon 55.1MMM LTV/HLTV 53.7MMM MAXLS 0.97455705 WAOLS Orig Amt Curr Amt Factor # Pools O MED 116 PSA 5.4727 +300 MED 82 PSA 5.2983 679 4.0% 79/78Accrual 1,866,000 Next Pay 455,479 1) Price-to-Yield +200 MED 89 PSA 5.3338 +100 MED 99 PSA 5.3848 (2) Please draw three lines in a single chart 1/1-1/31Age 2/25/23 WAM 353 WAC 4.855 -100 MED 224 PSA As of 01/2023 - 6 OYr 6Mo 29Yr 5Mo 6.0489 -200 MED 554 PSA 7.8047 -300 MED 1434 PSA 11.63 10.73 6.60 3.17 1.39 9.94 11.25 6.86 7.82 7.60 7.31 4.88 2.61 1.22 2/23-6/52 2/23-6/52 2/23-6/52 2/23-6/52 2/23-6/52 2/23-6/52 2/23-3/39 I Spread 205 182 187 194 257 404 770 Jan23 Dec Nov Oct Sep Aug Jul Jun May Apr Mar Feb GOVT(I) 6M 1Y 2Y 3Y 5Y 7Y 10Y 30Y 268P 336 501 605 861 987 1446 1451 698 772 695 704 4.80 4.63 4.13 3.84 3.56 3.50 3.45 3.60 3.1C 3.3 4.0 3.9 5.0 4.9 5.5 3.8 1.4 45.6 40.6 40.8 Disc 30/360 01/25/23 12.1226 (1) Please draw a line chart a. between Prepayment Speed in PSA and Avg Life (AL) (in Years) b. between Prepayment Speed in PSA and Modified Duration (in Years) Please describe their relationship using the charts. a. Yield and Interest rate scenario when Price = 100; b. Yield and Interest rate scenario when Price = 110; c. Yield and Interest rate scenario when Price = 95; Please describe the Yield pattern across interest rate scenarios under Discount Par and Premium price, respectively. From the yield variance patterns, what conclusions can you reach based on fundamental risk-return theory? d. Do you think the return measure "Yield" is a good return measure for Agency MBS pools? And why? Can you think of better return measure for Agency MBS pools? Below are three Bloomberg yield tables for a Fannie Mae 30-year MBS under three different prices as input, (1) Par price 100; (2) Premium Price 110; and (3) Discount Price 95. Under seven standard interest rate (and prepayment speed scenarios) +300: +300 MED (82 PSA) +200: +200 MED (89 PSA) +100: +100 MED (99 PSA) Base: 0 MED (116 PSA) -100: -100 MED (224 PSA) -200: -200 MED (554 PSA) -300: -300 MED (1434 PSA) Yield Table When Price = 100 Actions Export Settings 100% FNCL 4.0 1/2023 268P 3.1 0.2B 354 3.4 0.1 520 4.0 0.1 3Mo 6Mo 12Mo Life Settle Vary Price 3Mo 6Mo -- Avg Life Mod Duration Prin Win 12Mo Life Settle Vary 743 3.9 Price -- 01/12/23 100-00 0 -- 743 3.9 Avg Life Mod Duration Prin Win Y 01/12/23 -- 0 110-00 4.855(353)6 CUSIP 01F040610 Pool Level Coupon Orig Amt Curr Amt 55.1MMM LTV/HLTV 53.7MMM MAXLS 0.97455705 WAOLS 679 Factor # Pools -- O MED 116 PSA 3.9976 Yield Table When Price = 110 Actions Export Settings 100% FNCL 4.0 1/2023 268P 3.10 0.2B 354 3.4 0.1 520 4.0 0.1 9.94 7.42 2/23-6/52 I Spread 57 53 54 Jan23 Dec Nov Oct Sep Aug Jul Jun May Apr Mar Feb 268P 336 501 605 861 1446 1451 861 987 1446 1451 698 772 695 704 3.1C 3.3 4.0 3.9 5.0 987 4.9 5.5 3.8 1.4 45.6 40.6 40.8 1.4 45.6 40.6 40.8 Disc 30/360 Orig Amt Curr Amt Factor # Pools +300 MED O MED 82 PSA 116 PSA 4.0018 2.7579 11.63 8.42 2/23-6/52 2/23-6/52 D) Price-to-Yield +200 MED 89 PSA 4.0010 +300 MED 11.25 8.20 4.855(353)6 CUSIP 01F040610 Pool Level 82 PSA 2.9070 Coupon 55.1MMM LTV/HLTV 53.7MMM MAXLS 0.97455705 WAOLS 679 4.0% 79/78Accrual 1,866,000 Next Pay 455,479 1) Price-to-Yield +200 MED 89 PSA +100 MED 2.8767 99 PSA 3.9997 4.0% 79/78Accrual 1,866,000 Next Pay 455,479 +100 MED 99 PSA 2.8331 -100 MED 224 PSA 1/1-1/31Age 2/25/23 WAM 3.9833 -100 MED 224 PSA 10.73 6.60 3.17 1.39 2.84 7.89 5.32 1.32 2/23-6/52 2/23-6/52 2/23-6/52 2/23-3/39 55 50 17 -59 GOVT (1) 6M 1Y 2Y 3Y 5Y 74 10Y 30Y 4.80 4.63 4.13 3.84 3.56 3.50 3.45 3.60 01/25/23 2.2601 WAC 4.855 As of 01/2023 -200 MED 6 OYr 6Mo 353 29Yr 5Mo 554 PSA 3.9395 -200 MED As of 01/2023 1/1-1/31 Age 6 0Yr 6Mo 2/25/23 WAM 353 29Yr 5Mo WAC 4.855 554 PSA 0.7026 -300 MED 1434 PSA 3.8310 -300 MED 1434 PSA -3.1692 9.94 11.63 11.25 10.73 6.60 1.39 3.17 7.95 8.98 8.75 8.43 5.74 3.05 1.40 2/23-6/52 2/23-6/52 2/23-6/52 2/23-6/52 2/23-6/52 2/23-6/52 2/23-3/39 I Spread -67 -57 -59 -62 -122 -307 -759 Jan23 Dec Nov Oct Sep Aug Jul Jun May Apr Mar Feb GOVT(I) 6M 1Y 2Y 3Y 5Y 7Y 10Y 30Y 268P 336 501 605 861 987 1446 1451 698 772 695 704 4.80 4.63 4.13 3.84 3.56 3.50 3.45 3.60 3.1C 3.3 4.0 3.9 5.0 4.9 5.5 3.8 1.4 45.6 40.6 40.8 Disc 30/360 01/25/23 Yield Table When Price = 90 Actions Export Settings 100% FNCL 4.0 1/2023 268P 3.1C 0.2B 3Mo 354 3.4 0.1 6Mo 12Mo 520 4.0 0.1 Life Settle Vary Price -- 743 3.9 01/12/23 Avg Life Mod Duration Prin Win 0 90-00 4.855(353)6 CUSIP 01F040610 Pool Level Coupon 55.1MMM LTV/HLTV 53.7MMM MAXLS 0.97455705 WAOLS Orig Amt Curr Amt Factor # Pools O MED 116 PSA 5.4727 +300 MED 82 PSA 5.2983 679 4.0% 79/78Accrual 1,866,000 Next Pay 455,479 1) Price-to-Yield +200 MED 89 PSA 5.3338 +100 MED 99 PSA 5.3848 (2) Please draw three lines in a single chart 1/1-1/31Age 2/25/23 WAM 353 WAC 4.855 -100 MED 224 PSA As of 01/2023 - 6 OYr 6Mo 29Yr 5Mo 6.0489 -200 MED 554 PSA 7.8047 -300 MED 1434 PSA 11.63 10.73 6.60 3.17 1.39 9.94 11.25 6.86 7.82 7.60 7.31 4.88 2.61 1.22 2/23-6/52 2/23-6/52 2/23-6/52 2/23-6/52 2/23-6/52 2/23-6/52 2/23-3/39 I Spread 205 182 187 194 257 404 770 Jan23 Dec Nov Oct Sep Aug Jul Jun May Apr Mar Feb GOVT(I) 6M 1Y 2Y 3Y 5Y 7Y 10Y 30Y 268P 336 501 605 861 987 1446 1451 698 772 695 704 4.80 4.63 4.13 3.84 3.56 3.50 3.45 3.60 3.1C 3.3 4.0 3.9 5.0 4.9 5.5 3.8 1.4 45.6 40.6 40.8 Disc 30/360 01/25/23 12.1226 (1) Please draw a line chart a. between Prepayment Speed in PSA and Avg Life (AL) (in Years) b. between Prepayment Speed in PSA and Modified Duration (in Years) Please describe their relationship using the charts. a. Yield and Interest rate scenario when Price = 100; b. Yield and Interest rate scenario when Price = 110; c. Yield and Interest rate scenario when Price = 95; Please describe the Yield pattern across interest rate scenarios under Discount Par and Premium price, respectively. From the yield variance patterns, what conclusions can you reach based on fundamental risk-return theory? d. Do you think the return measure "Yield" is a good return measure for Agency MBS pools? And why? Can you think of better return measure for Agency MBS pools?
Expert Answer:
Answer rating: 100% (QA)
1 a The relationship between prepayment speed in PSA and average life AL in years is inverse As prepayment speed increases average life decreases High... View the full answer

Related Book For 

Posted Date:
Students also viewed these finance questions
-
Which stakeholders do you serve in your role as a clinical laboratory scientist? How can you cultivate better relationships with them?
-
The challenge of development is to improve the quality of life which calls for higher income, sustenance, self-esteem, and freedom. Critically analyze the challenges of development in China. Give...
-
Explore the ethical and regulatory considerations surrounding data privacy and security practices in database management, including compliance with frameworks such as GDPR (General Data Protection...
-
In Exercises 7192, find and simplify the difference quotient f(x +h)-f(x) h -, h = 0
-
In the Journal of Quality in Maintenance Engineering (Vol. 9, 2003), researchers used an analytic hierarchy process to help build a preferred maintenance organization for ARTHUR, the Norwegian Army's...
-
Consider the actual purchase several years ago of boat maker Bayliner by Brunswick Corporation, modified slightly to simplify the numbers. The purchase price was $400 million for a 100% interest....
-
Define marriage and critical rules associated with it in different cultures.
-
Kenworth Company uses a job-order costing system. Only three jobsJob 105, Job 106, and Job 107were worked on during November and December. Job 105 was completed on December 10; the other two jobs...
-
In March, Roland had revenues of $612,000 fixed costs of $199,260, and a profit of $51,660. Answer the following questions: Required: a. What was the contribution margin ratio? b. What monthly sales...
-
Midwestern Hardware must decide how many snow shovels to order for the coming snow season. Each shovel costs $ 15.00 and is sold for $ 29.95. No inventory is carried from one snow season to the next....
-
WACC Calculations D/A E/A rdebt requity tax rate WACC 0.600 0.400 6% 30% 25% 14.70%
-
Under the provisions of the Companies Act, 2017, list down the circumstances under which a company shall be deemed to be unable to pay its debts. Also discuss the conditions which a prospective...
-
No 1 following BVP (Boundry value Proble equation Solve the semilinear x+20) Ux + yly 14(x, y) =0 on y=x 2 ONO 2 Solve the following Boundary value Problem (BVP) cemilinear equation. Ux + (x+20) Uy...
-
PLEASE ANSWER THE 2 QUESTIONS AT THE TOP, THE EXPERIMENT IS BELOW. 1. Write down the mechanism showing the movement of electrons to form the product from starting materials. 2. H NMR of...
-
JohnnyCakes, Inc. is a calendar year accrual basis taxpayer; it manufactures industrial water pumps. It has the following financial information for the 2018 taxable year: Balance Sheet Beginning...
-
assume that the hole concentration is not significantly affected by optical pumping and thus the quasi Fermi level for holes, Fp, is degenerate with the valence band edge, i.e. Fp = Ey. Calculate the...
-
Show that the linear congruences in two variables ax+by cx + dy = w mod n z mod n
-
Repeat Exercise 16.6 using the t-test of the coefficient of correlation. Is this result identical to the one you produced in Exercise 16.6?
-
Describe the benefits and risks entailed with an experimental approach to regression analysis.
-
Beta is a common measure of stock-market risk or volatility. It is typically estimated as the slope coefficient for a simple regression model in which stock returns over time are the dependent Y...
-
Do equal distances along a given production process ray in a linear programming problem always represent an identical level of output?
-
A heavy machine weighing \(9810 \mathrm{~N}\) is being lowered vertically down by a winch at a uniform velocity of \(2 \mathrm{~m} / \mathrm{s}\). The steel cable supporting the machine has a...
-
The natural frequency of a spring-mass system is found to be \(2 \mathrm{~Hz}\). When an additional mass of \(1 \mathrm{~kg}\) is added to the original mass \(m\), the natural frequency is reduced to...
-
Derive the expression for the natural frequency of the system shown in Fig. 2.60. Note that the load \(W\) is applied at the tip of beam 1 and midpoint of beam 2. , E, I W 12, E2, 12 FIGURE 2.60 Load...

Study smarter with the SolutionInn App