

Question: Below are three regression model that help predict the gross drug cost. Based on the R square, coefficients, t stat, and P-value, what model is
Below are three regression model that help predict the gross drug cost. Based on the R square, coefficients, t stat, and P-value, what model is the best in predicting the gross drug cost? Why? (For purposes of this assignment, the best models are those that have the smallest prediction errors for future realized drug costs.)
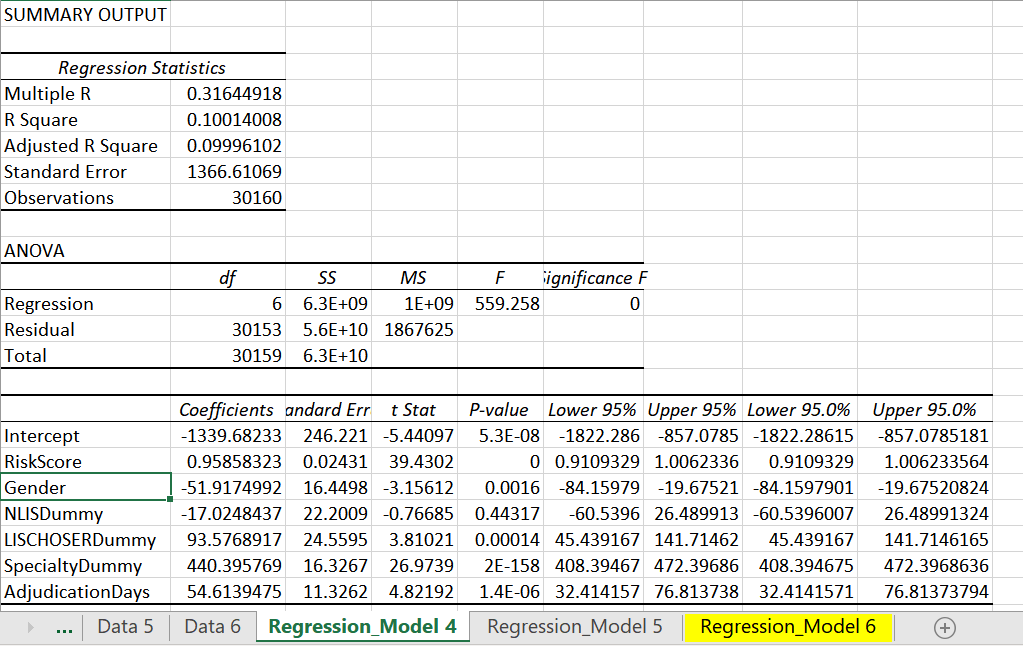
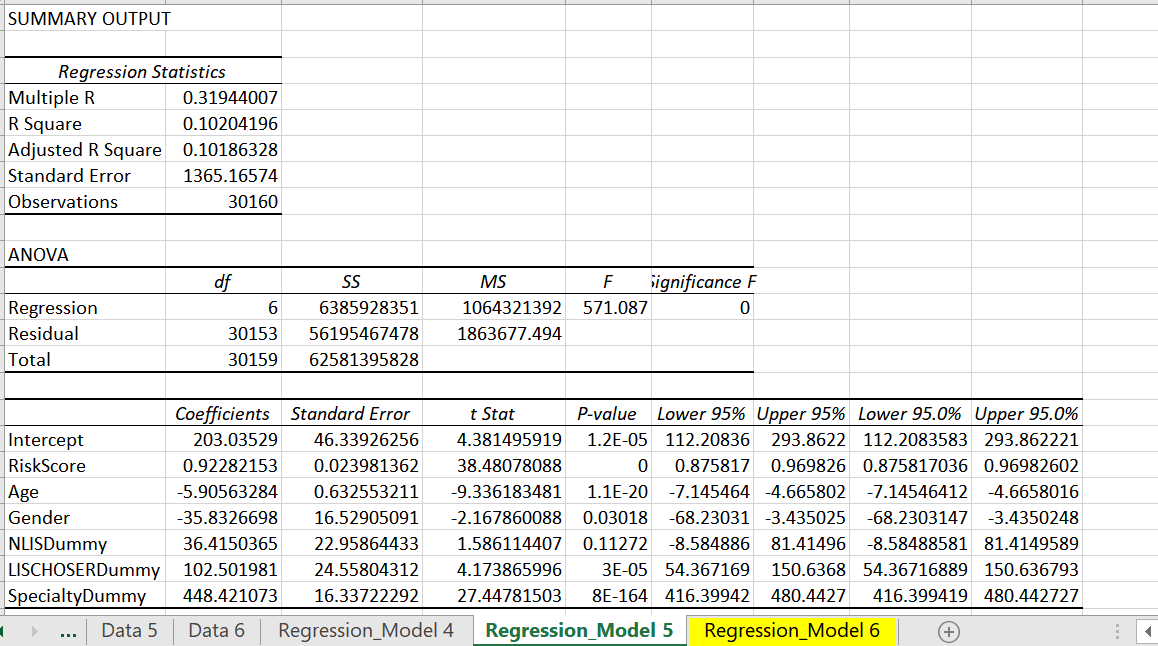
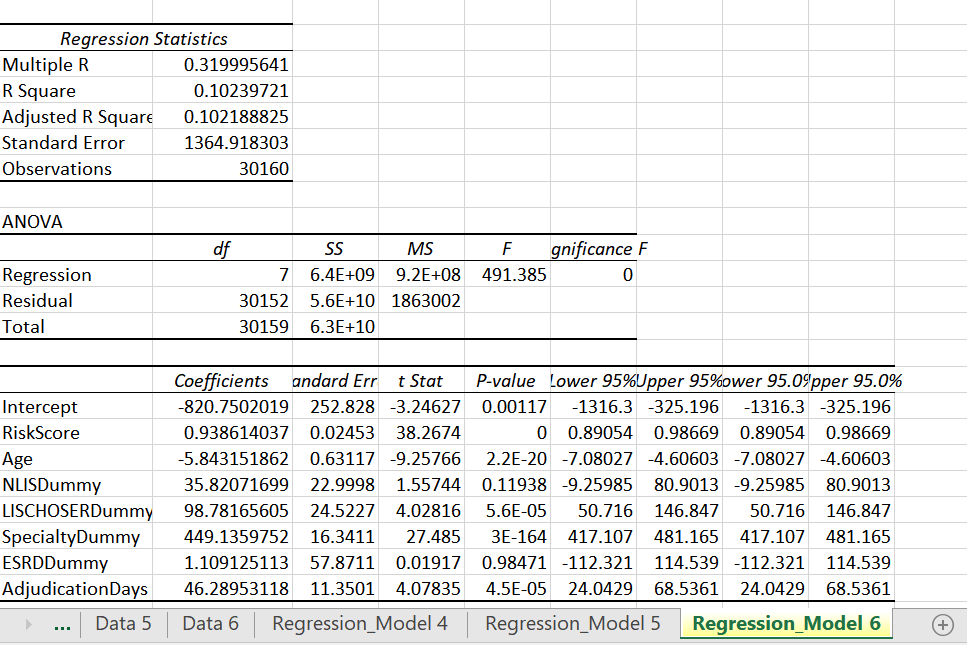
SUMMARY OUTPUT Regression Statistics Multiple R 0.31644918 R Square 0.10014008 Adjusted R Square 0.09996102 Standard Error 1366.61069 Observations 30160 ANOVA df SS MS F ignificance F Regression 6 6.3E+09 1E+09 559.258 0 Residual 30153 5.6E+10 1867625 Total 30159 6.3E+10 Coefficients andard Err t Stat P-value Lower 95% Upper 95% Lower 95.0% Upper 95.0% Intercept 1339.68233 246.221 -5.44097 5.3E-08 -1822.286 -857.0785 -1822.28615 -857.0785181 RiskScore 0.95858323 0.02431 39.4302 0 0.9109329 1.0062336 0.9109329 1.006233564 Gender -51.9174992 16.4498 -3.15612 0.0016 -84.15979 -19.67521 -84.1597901 -19.67520824 NLISDummy -17.0248437 22.2009 -0.76685 0.44317 -60.5396 26.489913 -60.5396007 26.48991324 LISCHOSERDummy 93.5768917 24.5595 3.81021 0.00014 45.439167 141.71462 45.439167 141.7146165 SpecialtyDummy 440.395769 16.3267 26.9739 2E-158 408.39467 472.39686 408.394675 472.3968636 AdjudicationDays 54.6139475 11.3262 4.82192 1.4E-06 32.414157 76.813738 32.4141571 76.81373794 Data 5 Data 6 Regression Model 4 Regression_Model 5 Regression_Model 6 +SUMMARY OUTPUT Regression Statistics Multiple R 0.31944007 R Square 0.10204196 Adjusted R Square 0.10186328 Standard Error 1365.16574 Observations 30160 ANOVA df SS MS F Significance F Regression 6 6385928351 1064321392 571.087 0 Residual 30153 56195467478 1863677.494 Total 30159 62581395828 Coefficients Standard Error t Stat P-value Lower 95% Upper 95% Lower 95.0% Upper 95.0% Intercept 203.03529 46.33926256 4.381495919 1.2E-05 112.20836 293.8622 112.2083583 293.862221 RiskScore 0.92282153 0.023981362 38.48078088 0 0.875817 0.969826 0.875817036 0.96982602 Age -5.90563284 0.632553211 -9.336183481 1.1E-20 -7.145464 -4.665802 -7.14546412 -4.6658016 Gender -35.8326698 16.52905091 -2.167860088 0.03018 -68.23031 -3.435025 -68.2303147 -3.4350248 NLISDummy 36.4150365 22.95864433 1.586114407 0.11272 -8.584886 81.41496 -8.58488581 81.4149589 LISCHOSERDummy 102.501981 24.55804312 4.173865996 3E-05 54.367169 150.6368 54.36716889 150.636793 SpecialtyDummy 448.421073 16.33722292 27.44781503 8E-164 416.39942 480.4427 416.399419 480.442727 Data 5 Data 6 Regression_Model 4 Regression_Model 5 Regression_Model 6Regression Statistics Multiple R 0.319995641 R Square 0.10239721 Adjusted R Square 0.102188825 Standard Error 1364.918303 Observations 30160 ANOVA df SS MS F gnificance F Regression 7 6.4E+09 9.2E+08 491.385 0 Residual 30152 5.6E+10 1863002 Total 30159 6.3E+10 Coefficients andard Err t Stat P-value Lower 95%Upper 95%ower 95.09pper 95.0% Intercept -820.7502019 252.828 -3.24627 0.00117 -1316.3 -325.196 -1316.3 -325.196 RiskScore 0.938614037 0.02453 38.2674 0 0.89054 0.98669 0.89054 0.98669 Age -5.843151862 0.63117 -9.25766 2.2E-20 -7.08027 -4.60603 -7.08027 -4.60603 NLISDummy 35.82071699 22.9998 1.55744 0.11938 -9.25985 80.9013 -9.25985 80.9013 LISCHOSERDummy 98.78165605 24.5227 4.02816 5.6E-05 50.716 146.847 50.716 146.847 SpecialtyDummy 449.1359752 16.3411 27.485 3E-164 417.107 481.165 417.107 481.165 ESRDDummy 1.109125113 57.8711 0.01917 0.98471 -112.321 114.539 -112.321 114.539 AdjudicationDays 46.28953118 11.3501 4.07835 4.5E-05 24.0429 68.5361 24.0429 68.5361 . .. Data 5 Data 6 Regression_Model 4 Regression_Model 5 Regression_Model 6 +
Step by Step Solution
There are 3 Steps involved in it

Get step-by-step solutions from verified subject matter experts