

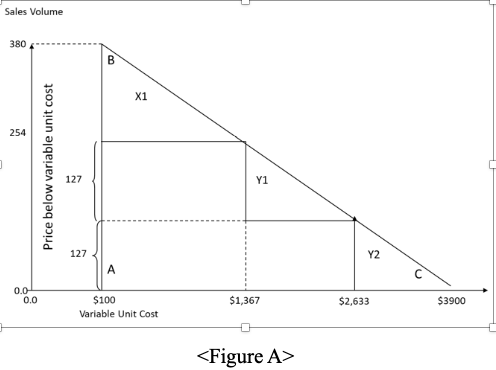
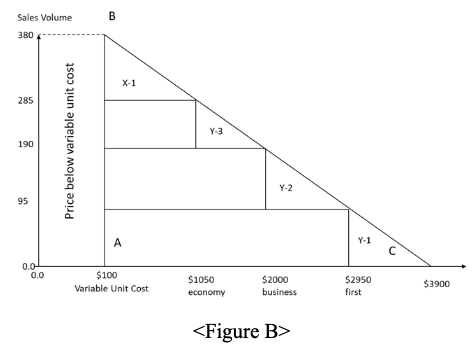
Question: Below are two different figures regarding an airline sales response curve. From revenue management perspectives, which pricing strategy (Figure A or Figure B) is better?
Below are two different figures regarding an airline sales response curve. From revenue management perspectives, which pricing strategy (Figure A or Figure B) is better? Explain in detail (For your information: You do not need to do any mathematical calculation. If you want, of course you can but it is NOT mandatory.)
Step by Step Solution
There are 3 Steps involved in it
1 Expert Approved Answer
Step: 1 Unlock

Question Has Been Solved by an Expert!
Get step-by-step solutions from verified subject matter experts
Step: 2 Unlock
Step: 3 Unlock