

Question: Below are two graphs showing the market share for certain food chains in the US in 2000 and 2020. Describe the graphs by using the
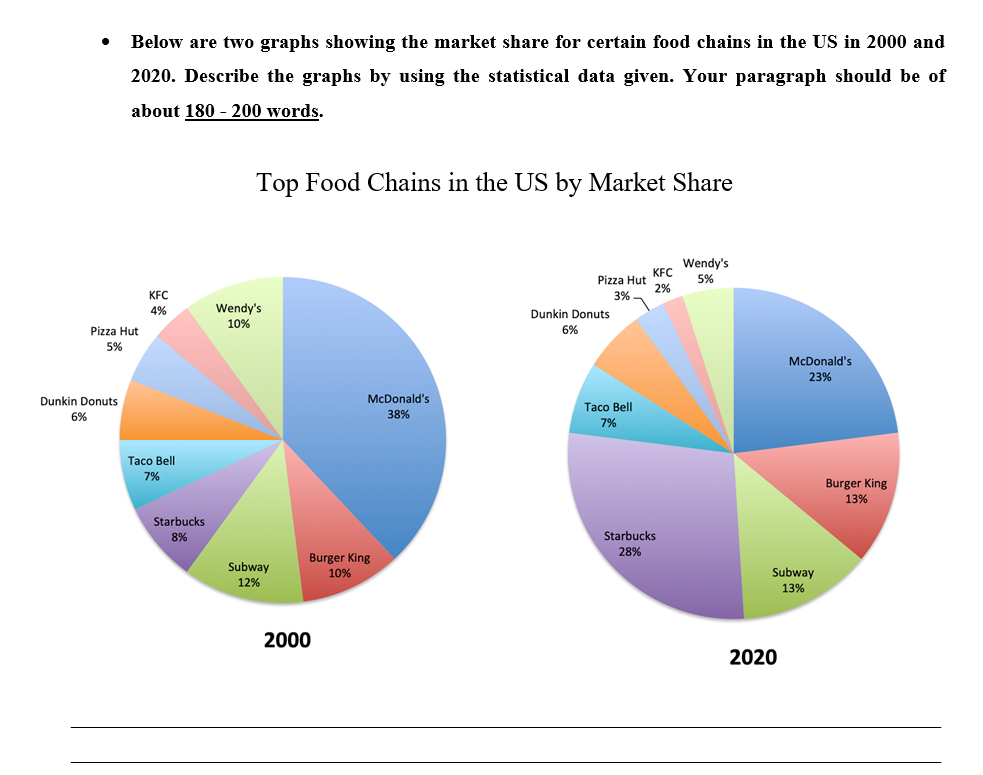
Below are two graphs showing the market share for certain food chains in the US in 2000 and 2020. Describe the graphs by using the statistical data given. Your paragraph should be of about 180 - 200 words. Top Food Chains in the US by Market Share KFC 2% Wendy's 5% KFC 4% Wendy's 10% Pizza Hut 3% Dunkin Donuts 6% Pizza Hut 5% McDonald's 23% Dunkin Donuts 6% McDonald's 38% Taco Bell 7% Taco Bell 7% Burger King 13% Starbucks 8% Starbucks 28% Subway 12% Burger King 10% Subway 13% 2000 2020
Step by Step Solution
There are 3 Steps involved in it
1 Expert Approved Answer
Step: 1 Unlock

Question Has Been Solved by an Expert!
Get step-by-step solutions from verified subject matter experts
Step: 2 Unlock
Step: 3 Unlock