

Question: Below are two run charts for a process. For each one, answer the following question: Based on the run chart, does the process appear to
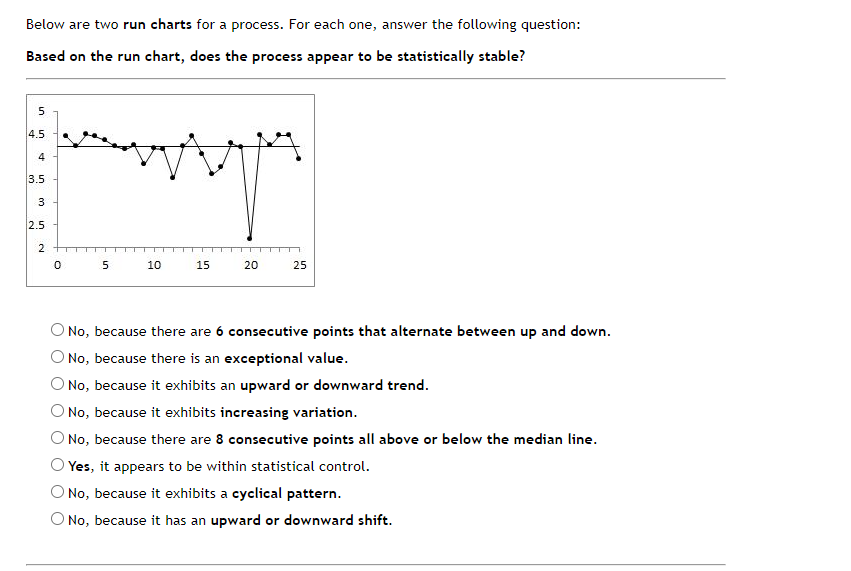
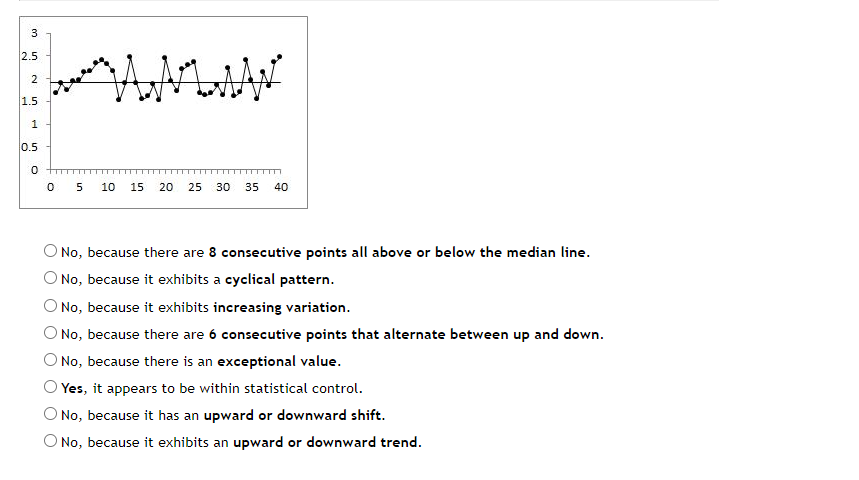
Below are two run charts for a process. For each one, answer the following question: Based on the run chart, does the process appear to be statistically stable? '3:_:3' No, because there are E: consecutive points that alternate between up and clown. '32} No, because there is an exceptional value. '33-:3' No, because it exhibits an upward or downward trend. 'iij' No, because it exhibits increasing variation. '33-:3' No, because there are 8 consecutive points all above or below the median line. '3:_:3' Yes, it appears to be within statistical control. '32} No, because it exhibits a cyclical pattern. '33-:3' No, because it has an upward or downward shift. 2.5 2 1.5 1 0.5 0 0 5 10 15 20 25 30 35 40 O No, because there are 8 consecutive points all above or below the median line. O No, because it exhibits a cyclical pattern. No, because it exhibits increasing variation. O No, because there are 6 consecutive points that alternate between up and down. O No, because there is an exceptional value. O Yes, it appears to be within statistical control. O No, because it has an upward or downward shift. O No, because it exhibits an upward or downward trend
Step by Step Solution
There are 3 Steps involved in it

Get step-by-step solutions from verified subject matter experts