

Question: Below are two SCL lines for two separate managed portfolios. Which of the graphs indicates good market timing by the portfolio manager? A) The curved
 Below are two SCL lines for two separate managed portfolios. Which of the graphs indicates good market timing by the portfolio manager? A) The curved SCL on the left B) The straight SCL on the right C) They both exhibit market timing D) Neither exhibits market timing
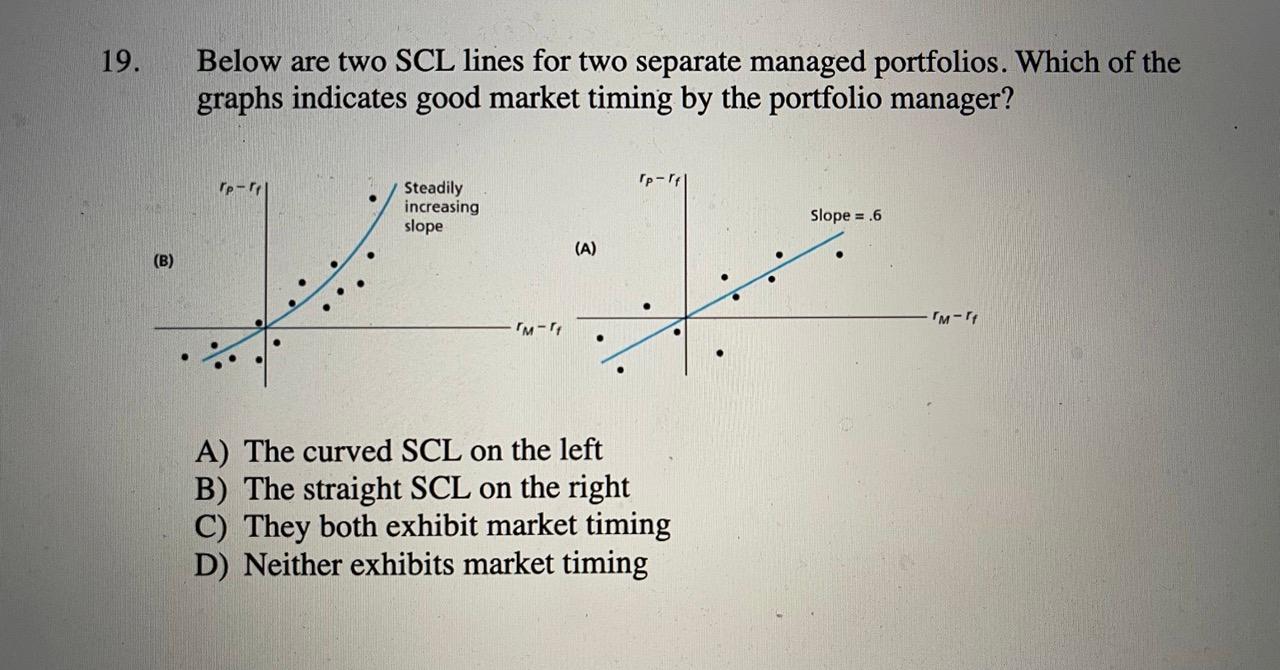
Below are two SCL lines for two separate managed portfolios. Which of the graphs indicates good market timing by the portfolio manager? A) The curved SCL on the left B) The straight SCL on the right C) They both exhibit market timing D) Neither exhibits market timing
Step by Step Solution
There are 3 Steps involved in it
1 Expert Approved Answer
Step: 1 Unlock

Question Has Been Solved by an Expert!
Get step-by-step solutions from verified subject matter experts
Step: 2 Unlock
Step: 3 Unlock