

Question: Below comparative data for Sigma Company presented as follows (amounts in S): December 31, 2020 December 31, 2019 S30,000 TT Cash $25,000 35,000 120,000
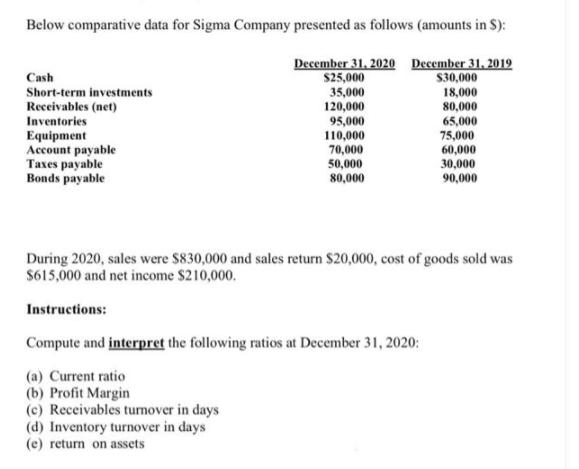
Below comparative data for Sigma Company presented as follows (amounts in S): December 31, 2020 December 31, 2019 S30,000 TT Cash $25,000 35,000 120,000 95,000 110,000 70,000 50,000 80,000 Short-term investments 18,000 Receivables (net) Inventories Equipment Account payable Taxes payable Bonds payable 80,000 65,000 75,000 60,000 30,000 90,000 During 2020, sales were $830,000 and sales return $20,000, cost of goods sold was $615,000 and net income $210,000. Instructions: Compute and interpret the following ratios at December 31, 2020: (a) Current ratio (b) Profit Margin (c) Receivables tumover in days (d) Inventory turnover in days (e) return on assets
Step by Step Solution
3.46 Rating (156 Votes )
There are 3 Steps involved in it
Curvent AccatsCuirent liabilitiand 275000170000 a Curorent Ratio 162 tmes Cuv... View full answer

Get step-by-step solutions from verified subject matter experts