

Question: Below figure shows AUC - ROC curves for three logistic regression models. Different colors show curves for different hyper parameters values. Which of the following
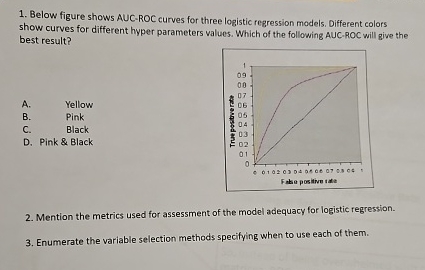
Below figure shows AUCROC curves for three logistic regression models. Different colors show curves for different hyper parameters values. Which of the following AUCROC will give the best result?
A Yellow
B Pink
C Black
D Pink & Black
Mention the metrics used for assessment of the model adequacy for logistic regression.
Enumerate the variable selection methods specifying when to use each of them.
Step by Step Solution
There are 3 Steps involved in it
1 Expert Approved Answer
Step: 1 Unlock

Question Has Been Solved by an Expert!
Get step-by-step solutions from verified subject matter experts
Step: 2 Unlock
Step: 3 Unlock