

Question: 3- acceleration analysis and acceleration - time plot It is required and each plot must contain graphs of analyzes within 3 input speeds as
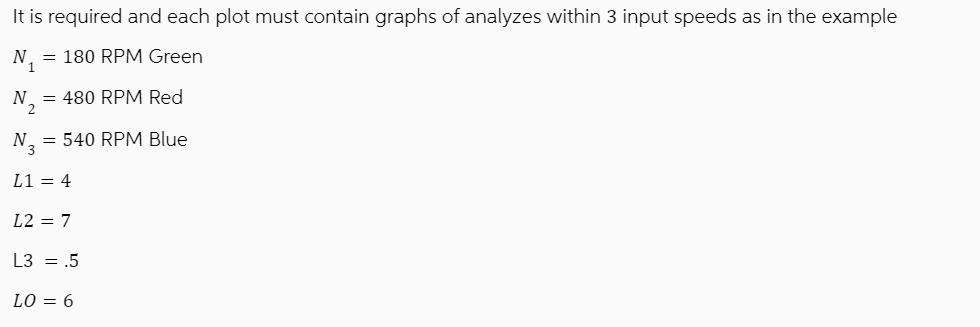
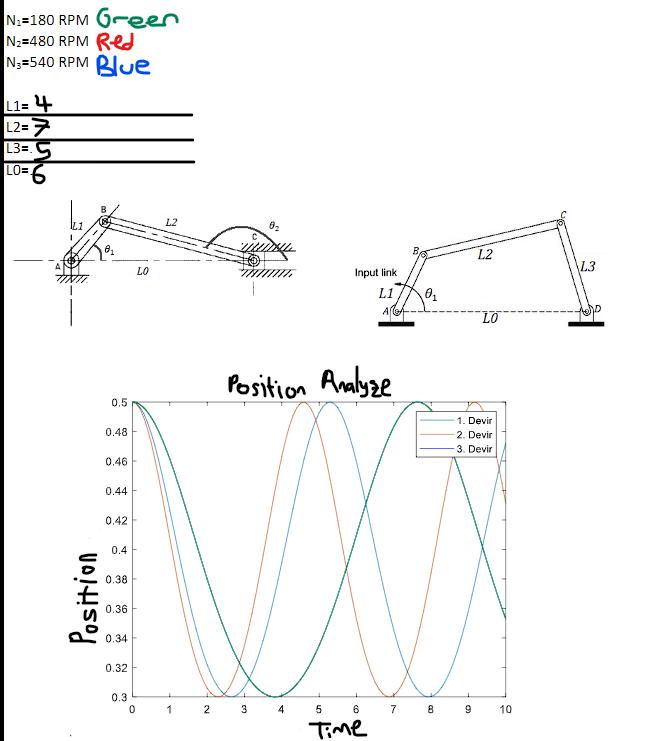
3- acceleration analysis and acceleration - time plot It is required and each plot must contain graphs of analyzes within 3 input speeds as in the example MATLAB SOFTWARE 2 For the length values "L0, L1, L2, L3" given for "Four link mechanism" and the input speed values "N1 ( green), N2 (red), N3 (blue)" respectively: 1 - position analysis and position - time plot 2 speed analysis and speed - time plot 3- acceleration analysis and acceleration - time plot Below, give the codes that can be used to create the desired plots using MATLAB. Look at the details in the attached photo. MATLAB SOFTWARE 1 For the length values "L0, L1, L2" given for "Slider crank mechanism" and the input speed values "N1 ( green), N2 (red), N3 (blue)" respectively: 1- position analysis and position - time plot 2- speed analysis and speed - time plot It is required and each plot must contain graphs of analyzes within 3 input speeds as in the example N = 180 RPM Green 1 N = 480 RPM Red = 540 RPM Blue L1 = 4 L2 = 7 L3 = .5 LO = 6 N-180 RPM Green N=480 RPM Red N-540 RPM Blue L1= 4 L2=7 L3=5 LO=6 Position 8 0.5 0.48 0.46 0.44 0.42 0.4 0.38 0.36 0.34 0.32 0.3 0 LO L2 1 0 2 3 Position Analyze Input link L1 A MM 4 5 6 Time 7 0 8 L2 9 LO 1. Devir 2. Devir 3. Devir 10 L3 tro
Step by Step Solution
3.44 Rating (151 Votes )
There are 3 Steps involved in it
To create the desired plots for the Slider Crank Mechanism and the Four Link Mechanism using MATLAB you can use the following codes Make sure to replace the length and speed values with the ones provi... View full answer

Get step-by-step solutions from verified subject matter experts