

Question: Below is a 4 stage RC ladder that models a segment of a wire or nervous conduction system. Simulate the circuit and display the Bode
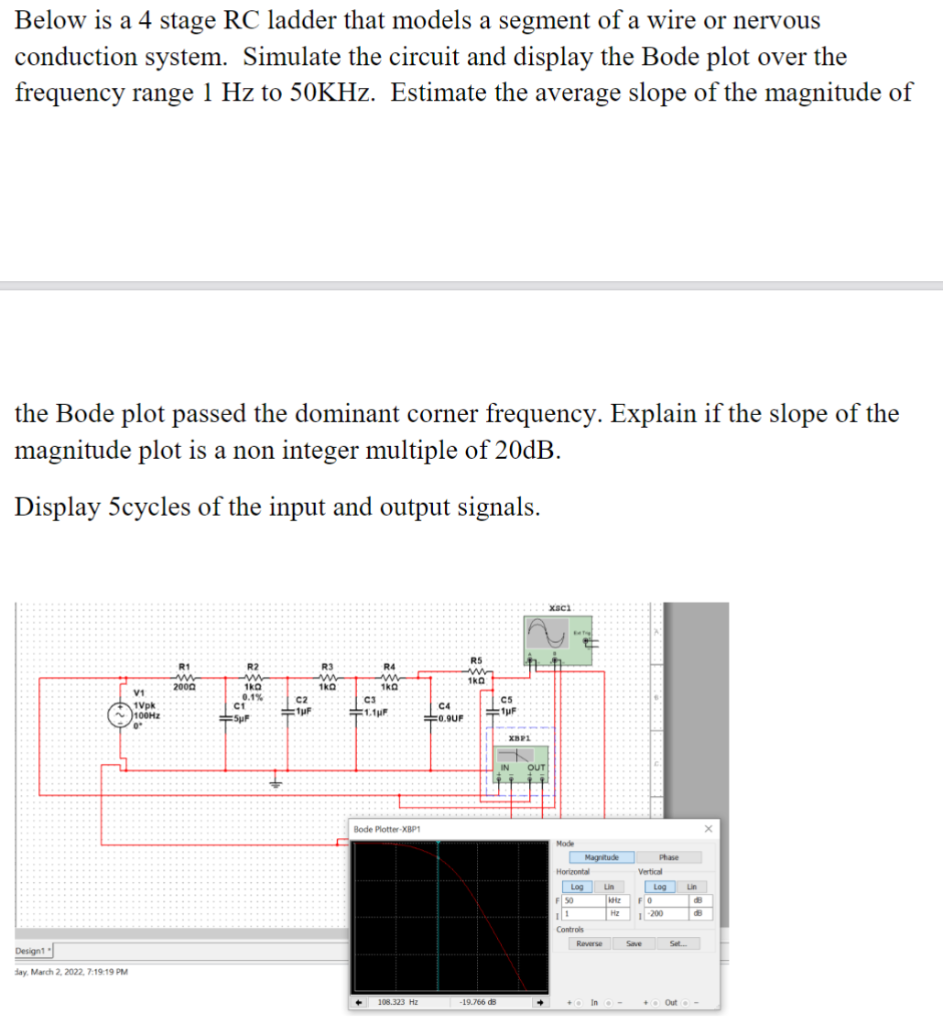
Below is a 4 stage RC ladder that models a segment of a wire or nervous conduction system. Simulate the circuit and display the Bode plot over the frequency range 1 Hz to 50KHz. Estimate the average slope of the magnitude of the Bode plot passed the dominant corner frequency. Explain if the slope of the magnitude plot is a non integer multiple of 20dB. Display 5cycles of the input and output signals. xaca RS R3 w 10 1ka R1 w w V1 2000 1Vpk 100Hz R2 w 10 0.1% CI SF to R4 w 10 C3 1. HF C2 F C4 FO.QUF C5 TF F XP: IN OUT Bode Plotter XBP1 Mod Phase in Magnitude Horizontal Log Lin FSO 11 HE Controls Reverse Vertical Log FO 1200 Save Set Design 1 Say, March 2, 2022, 7:19:19 PM 2 108.323 HE HZ -19.766 dB In -- + Out
Step by Step Solution
There are 3 Steps involved in it

Get step-by-step solutions from verified subject matter experts