

Question: Below is a bar graph showing the average ( Y ) value based on Group ( (A, B, C) ) and Location (North, South). If
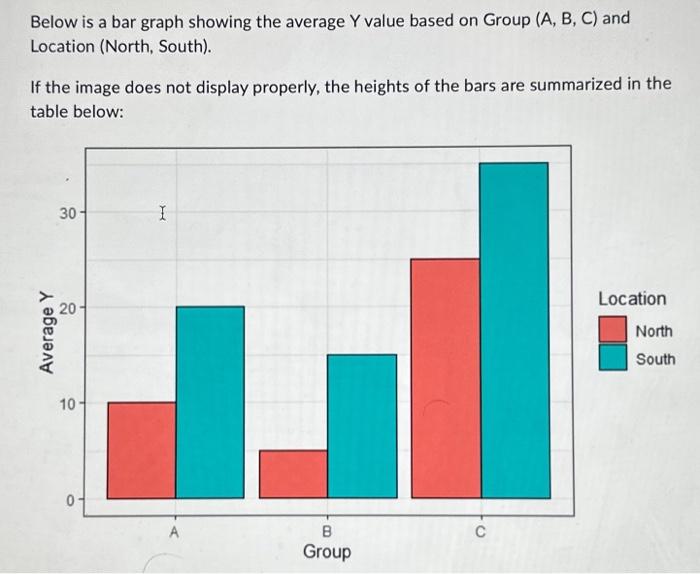
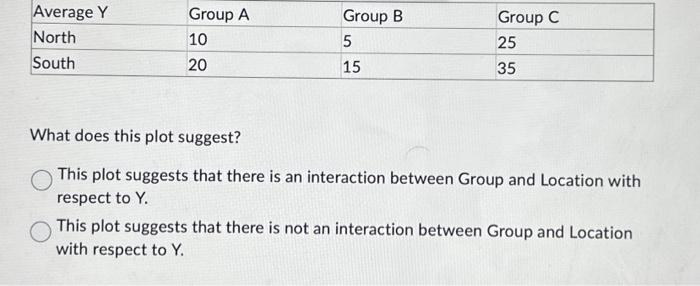
Below is a bar graph showing the average \\( Y \\) value based on Group \\( (A, B, C) \\) and Location (North, South). If the image does not display properly, the heights of the bars are summarized in the table below: What does this plot suggest? This plot suggests that there is an interaction between Group and Location with respect to \\( Y \\). This plot suggests that there is not an interaction between Group and Location with respect to \\( \\mathrm{Y} \\)
Step by Step Solution
There are 3 Steps involved in it
1 Expert Approved Answer
Step: 1 Unlock

Question Has Been Solved by an Expert!
Get step-by-step solutions from verified subject matter experts
Step: 2 Unlock
Step: 3 Unlock