

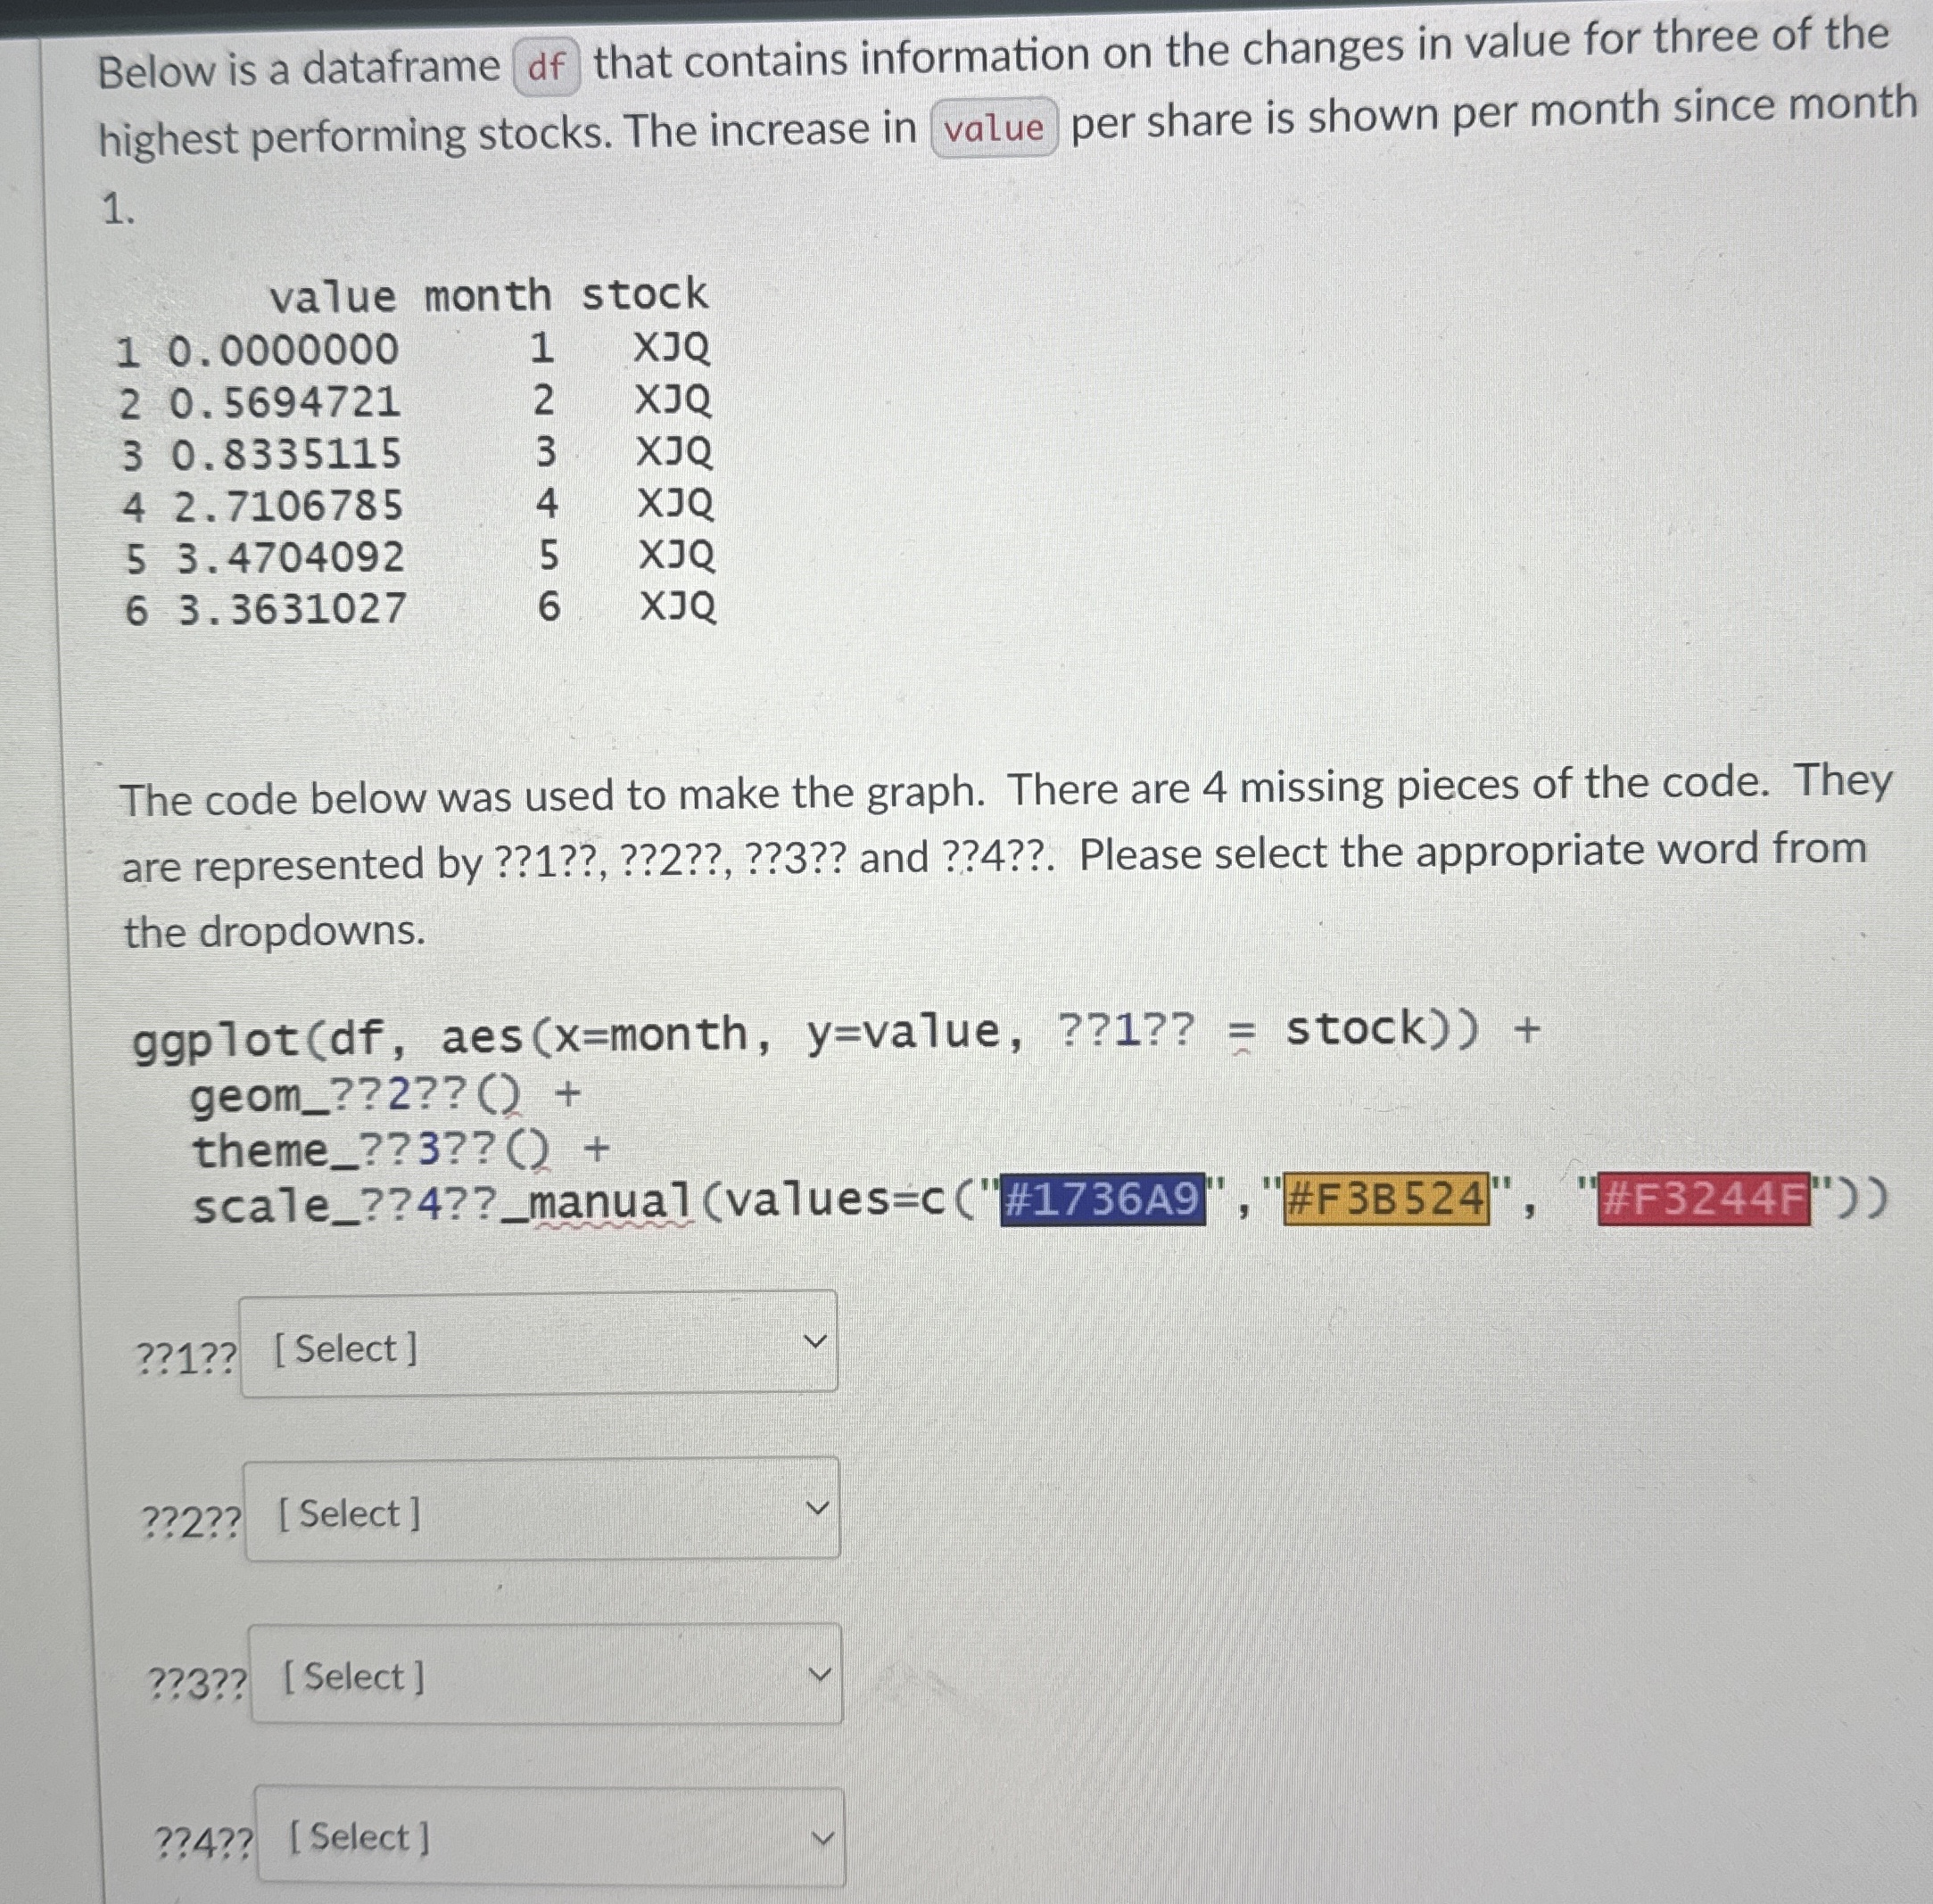
Question: Below is a dataframe df that contains information on the changes in value for three of the highest performing stocks. The increase in value per
Below is a dataframe df that contains information on the changes in value for three of the highest performing stocks. The increase in value per share is shown per month since month
The code below was used to make the graph. There are missing pieces of the code. They
are represented by and
ggplotdfaesxmonth,yvalue,?? stock geomthemescalemanualvaluesc#A#FB#FF
What is of the code? color, group, z or line??
What is of the code? curve, line, step, or color??
What is of the code? bw classic, none, or minimal??
What is of the code? fill, line, group, or color??
Step by Step Solution
There are 3 Steps involved in it
1 Expert Approved Answer
Step: 1 Unlock

Question Has Been Solved by an Expert!
Get step-by-step solutions from verified subject matter experts
Step: 2 Unlock
Step: 3 Unlock