

Question: Below is a flow chart for material flow analysis of steel in the construction industry, with all flows and system boundaries drawn in. You know
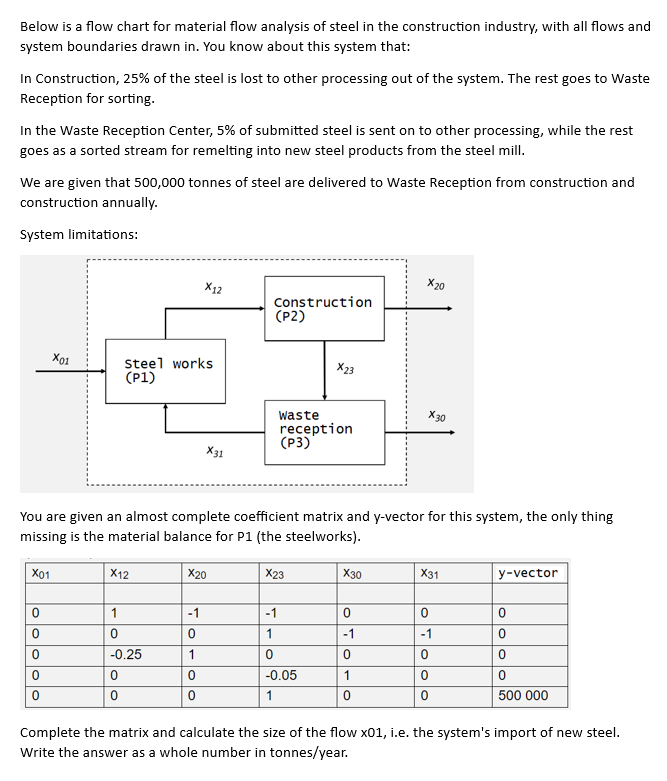
Below is a flow chart for material flow analysis of steel in the construction industry, with all flows and system boundaries drawn in. You know about this system that: In Construction, 25% of the steel is lost to other processing out of the system. The rest goes to Waste Reception for sorting. In the Waste Reception Center, 5% of submitted steel is sent on to other processing, while the rest goes as a sorted stream for remelting into new steel products from the steel mill. We are given that 500,000 tonnes of steel are delivered to Waste Reception from construction and construction annually. System limitations: You are given an almost complete coefficient matrix and y-vector for this system, the only thing missing is the material balance for P1 (the steelworks). Complete the matrix and calculate the size of the flow x01, i.e. the system's import of new steel. Write the answer as a whole number in tonnes/year
Step by Step Solution
There are 3 Steps involved in it

Get step-by-step solutions from verified subject matter experts