

Question: Below is a frequency distribution for our RCCC sample of men's heights. Frequency Class Class Midpoint (inches) 56-59 1 0 12 C. 60-63 64-67
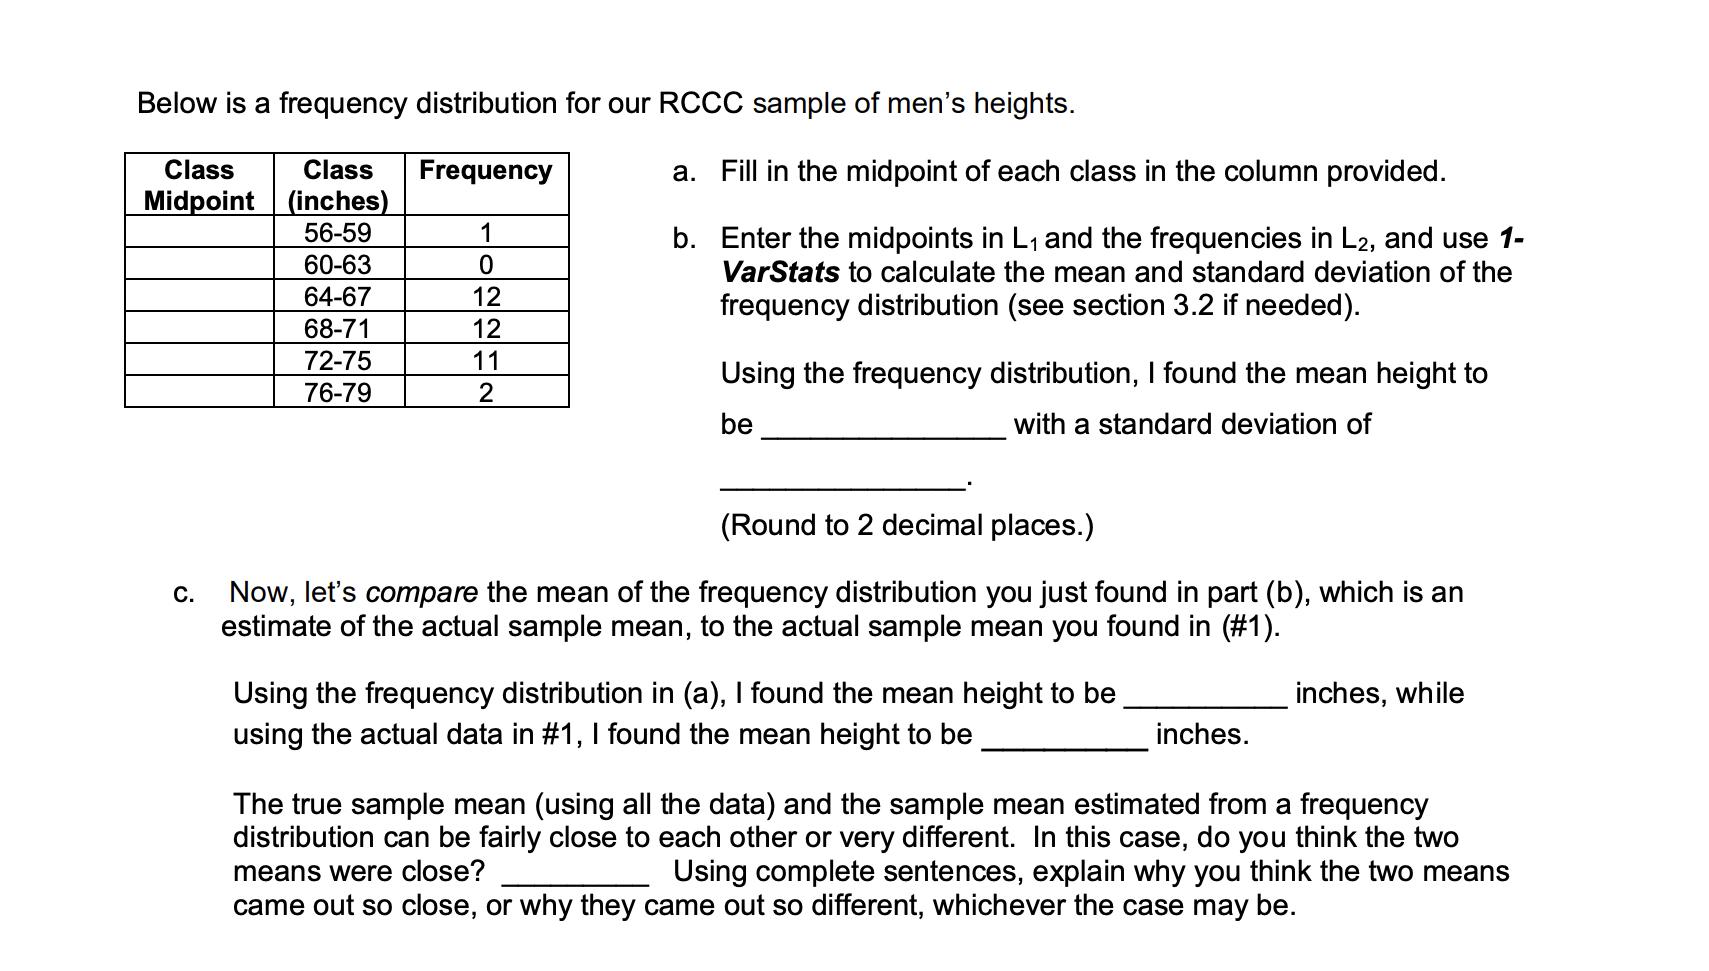
Below is a frequency distribution for our RCCC sample of men's heights. Frequency Class Class Midpoint (inches) 56-59 1 0 12 C. 60-63 64-67 68-71 72-75 76-79 12 11 2 a. Fill in the midpoint of each class in the column provided. b. Enter the midpoints in L and the frequencies in L2, and use 1- VarStats to calculate the mean and standard deviation of the frequency distribution (see section 3.2 if needed). Using the frequency distribution, I found the mean height to with a standard deviation of be (Round to 2 decimal places.) Now, let's compare the mean of the frequency distribution you just found in part (b), which is an estimate of the actual sample mean, to the actual sample mean you found in (#1). Using the frequency distribution in (a), I found the mean height to be using the actual data in #1, I found the mean height to be inches. inches, while The true sample mean (using all the data) and the sample mean estimated from a frequency distribution can be fairly close to each other or very different. In this case, do you think the two means were close? Using complete sentences, explain why you think the two means came out so close, or why they came out so different, whichever the case may be.
Step by Step Solution
3.40 Rating (163 Votes )
There are 3 Steps involved in it
A The midpoints of each class are 565 625 665 705 745 and 785 B Using the 1VarStats function I found the mean height to be 6975 inches with a standard ... View full answer

Get step-by-step solutions from verified subject matter experts