

Question: Below is a graph of a normal distribution with mean u =4 and standard deviation o = 2. The shaded region represents the probability of
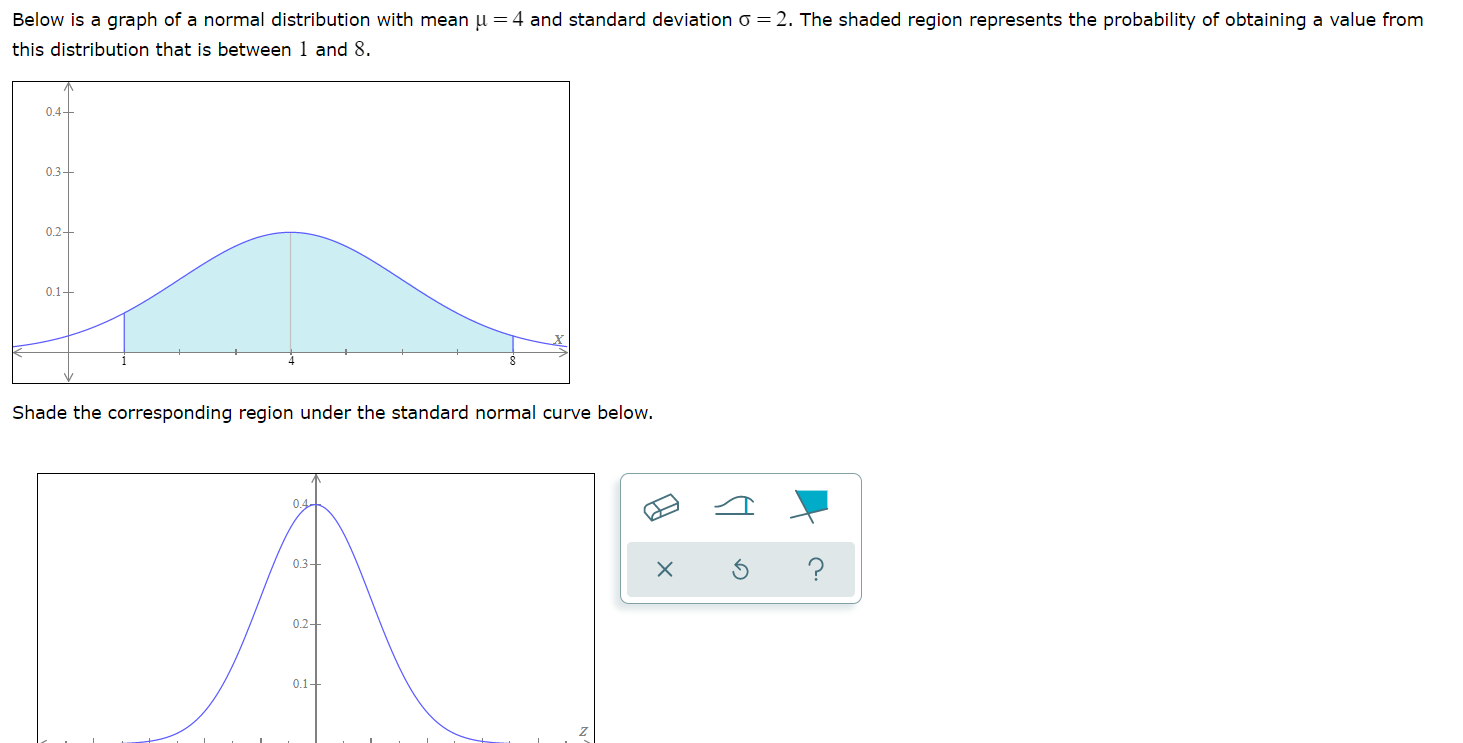

Below is a graph of a normal distribution with mean u =4 and standard deviation o = 2. The shaded region represents the probability of obtaining a value from this distribution that is between 1 and 8. 0.4- 03- 0.2-+ 0.1- 8 Shade the corresponding region under the standard normal curve below. 0.4- 03- X 5 ? 0.2-+ 0.1-+
Step by Step Solution
There are 3 Steps involved in it
1 Expert Approved Answer
Step: 1 Unlock

Question Has Been Solved by an Expert!
Get step-by-step solutions from verified subject matter experts
Step: 2 Unlock
Step: 3 Unlock