

Question: Below is a plot of channel width versus drainage area from 1 9 4 7 and again in 1 9 9 9 for a stream
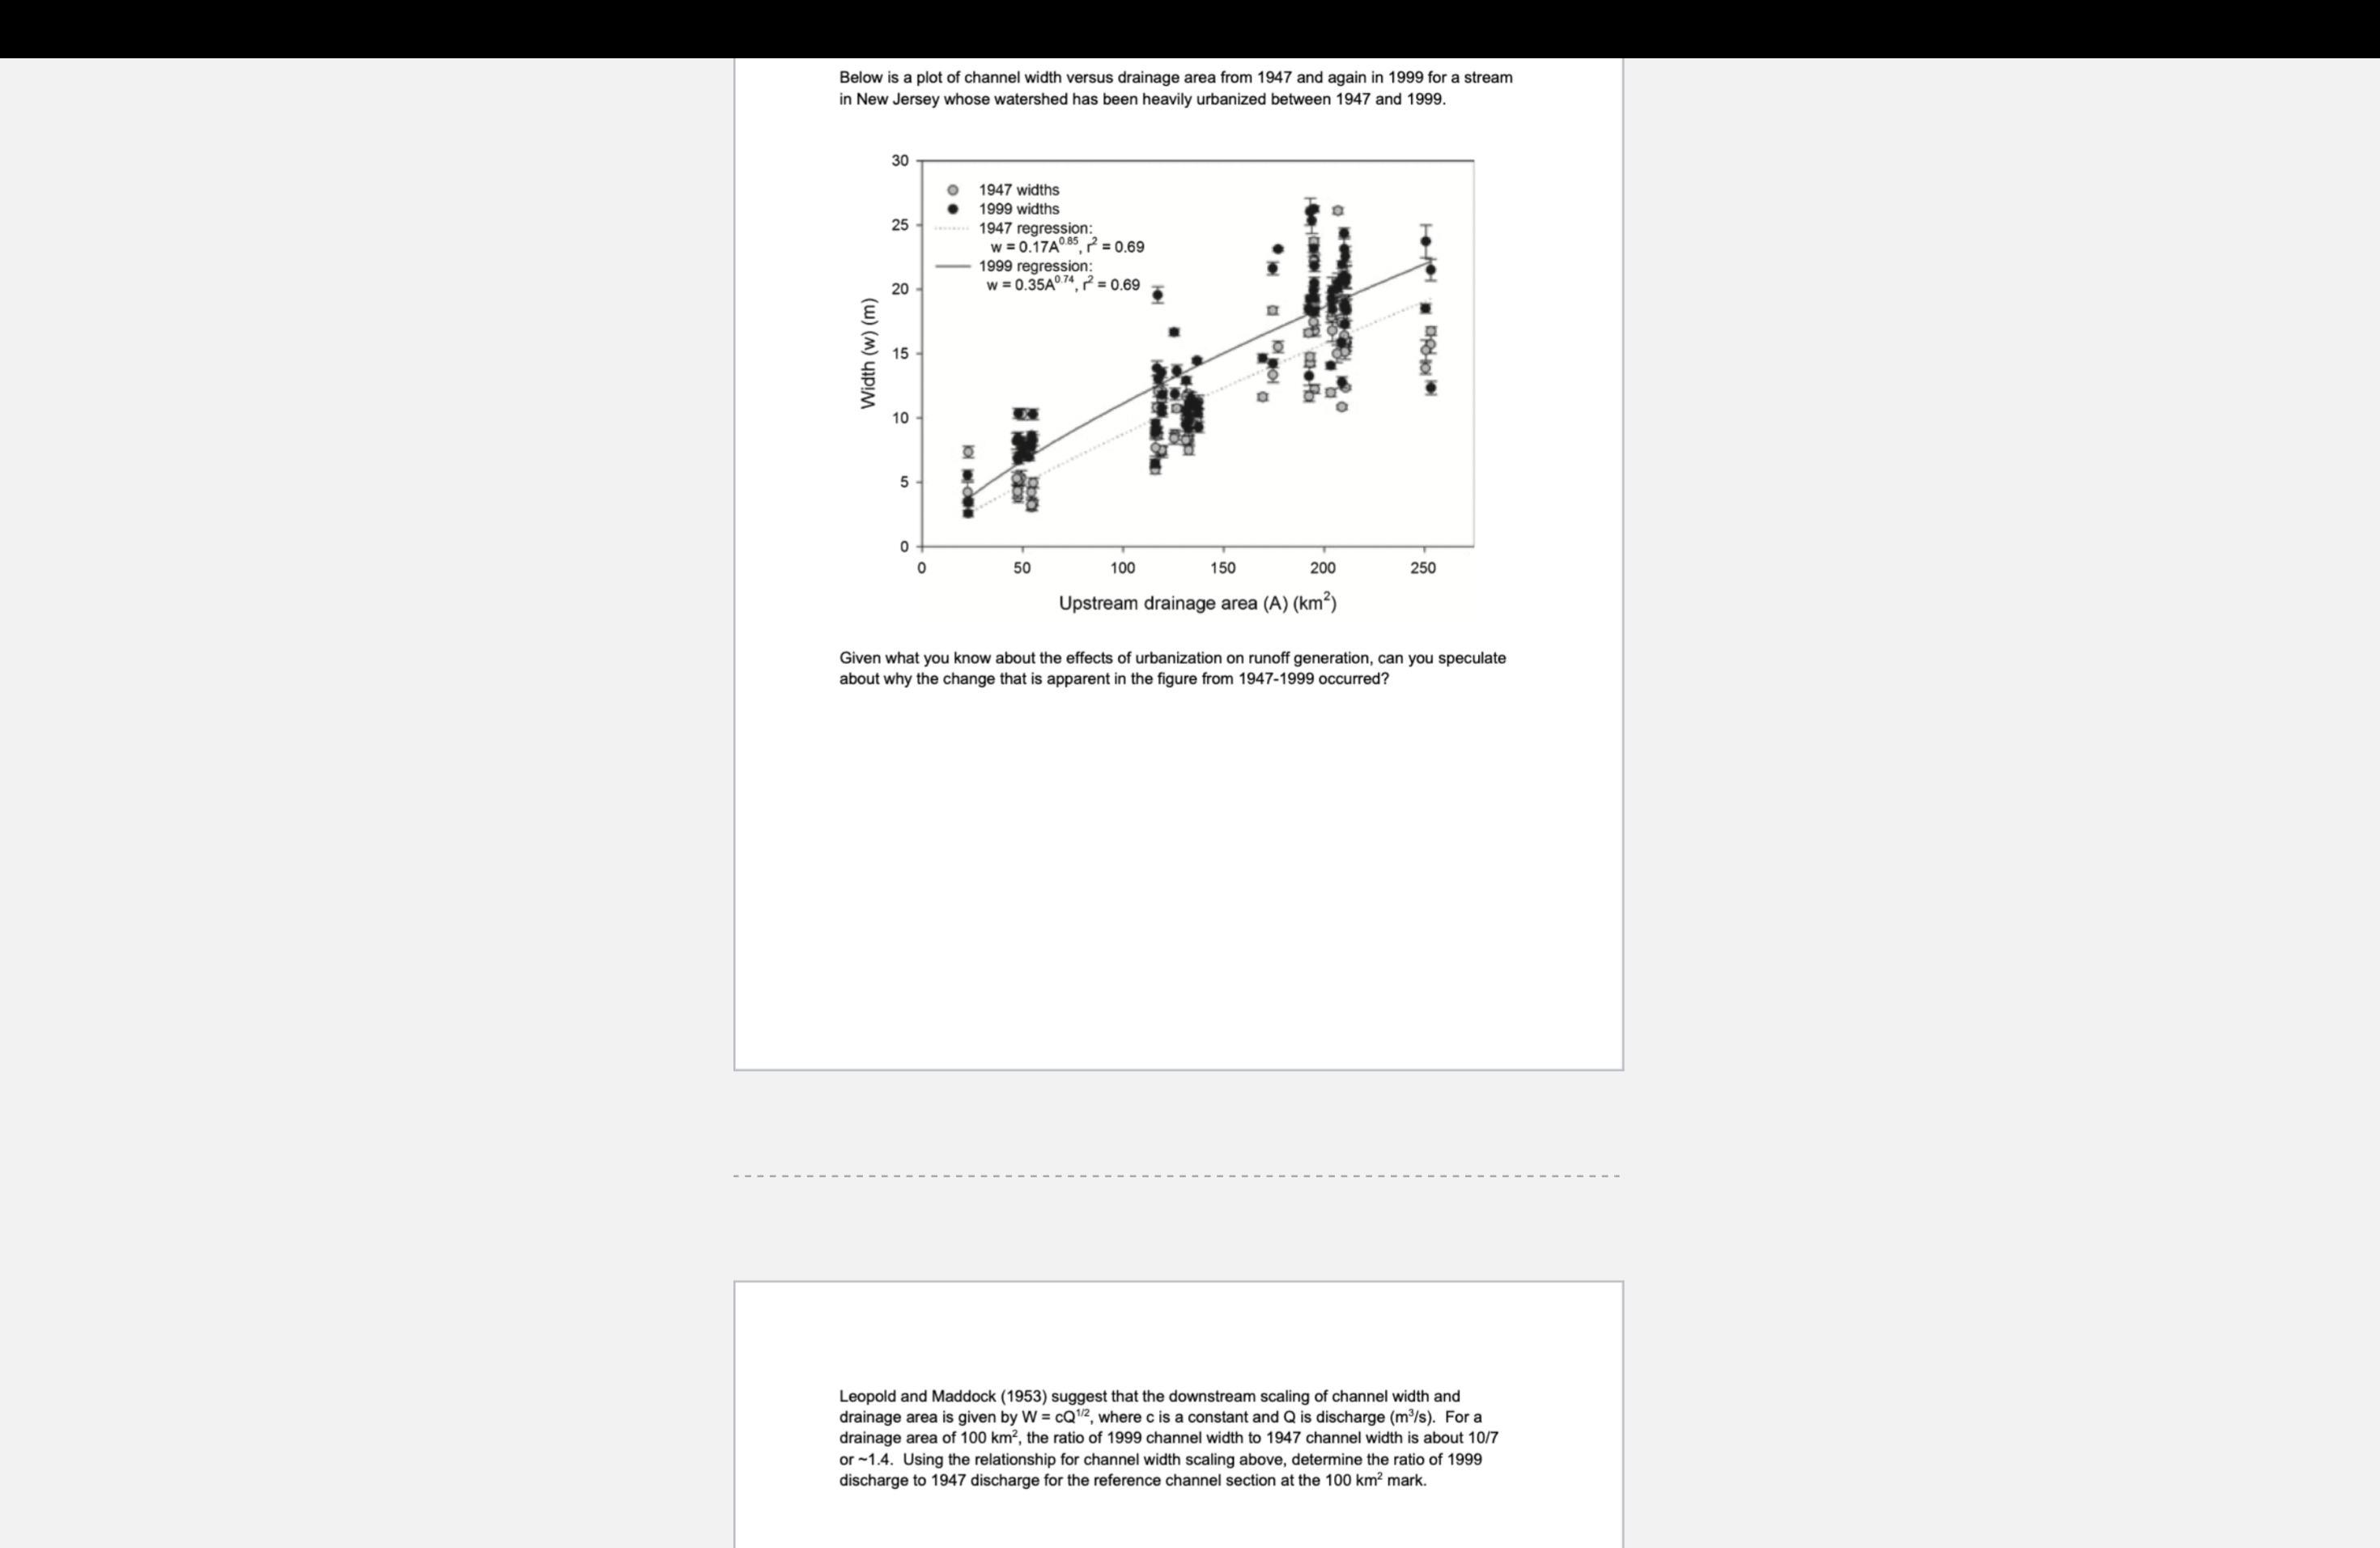
Below is a plot of channel width versus drainage area from and again in for a stream in New Jersey whose watershed has been heavily urbanized between and
Given what you know about the effects of urbanization on runoff generation, can you speculate about why the change that is apparent in the figure from occurred?
Leopold and Maddock suggest that the downstream scaling of channel width and drainage area is given by Wc Q where c is a constant and Q is discharge mathrmmmathrms For a drainage area of mathrm~km the ratio of channel width to channel width is about or sim Using the relationship for channel width scaling above, determine the ratio of discharge to discharge for the reference channel section at the mathrm~km mark.
Step by Step Solution
There are 3 Steps involved in it
1 Expert Approved Answer
Step: 1 Unlock

Question Has Been Solved by an Expert!
Get step-by-step solutions from verified subject matter experts
Step: 2 Unlock
Step: 3 Unlock