

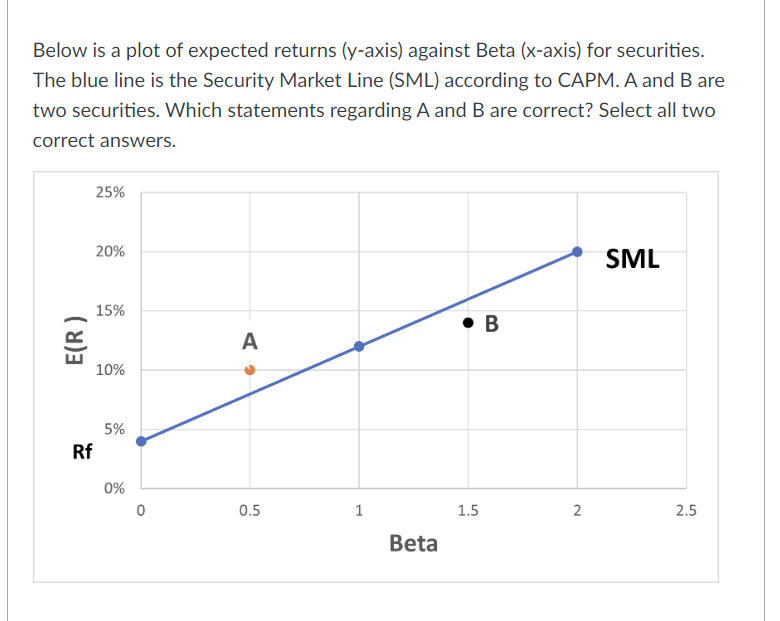
Question: Below is a plot of expected returns ( y - axis ) against Beta ( x - axis ) for securities . The blue line
Below is a plot of expected returns yaxis against Beta axis for securities
The blue line is the Security Market Line SML according to CAPM. A and B are
two securities Which statements regarding A and B are correct? Select all two
correct answers.
a A has a positive alpha
b A is overpriced
c B has a positive alpha
d B is overpriced
Step by Step Solution
There are 3 Steps involved in it
1 Expert Approved Answer
Step: 1 Unlock

Question Has Been Solved by an Expert!
Get step-by-step solutions from verified subject matter experts
Step: 2 Unlock
Step: 3 Unlock