

Question: a) Does a linear trendline seem unreasonable for this data? b) Does an exponential trendline seem unreasonable for this data? c) Write down the linear
 a) Does a linear trendline seem unreasonable for this data?
b) Does an exponential trendline seem unreasonable for this data?
c) Write down the linear model’s equation and describe what each of the items in the model mean in “real-world dice rolling terms”. 3
d) Write down the exponential model’s equation and describe what the positive value in the model means in “real-world dice rolling terms”.
e) How come the exponent is negative?
f) Where is the initial value in the linear model?
g) Where is the initial value in the exponential model?
h) Where is the rate in the linear model?
i) Where is the rate in the exponential model?
j) Which is a better model for this data? How can you determine this by looking at the chart of the data?
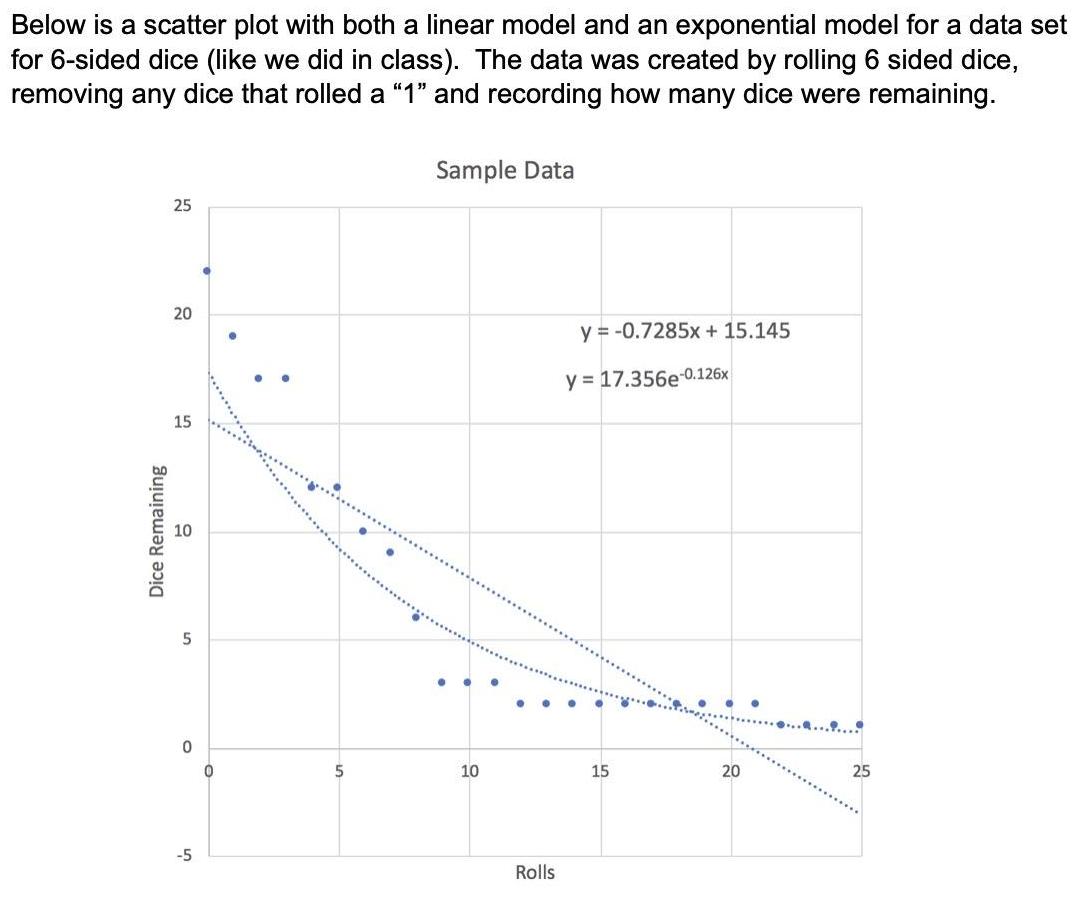
Below is a scatter plot with both a linear model and an exponential model for a data set for 6-sided dice (like we did in class). The data was created by rolling 6 sided dice, removing any dice that rolled a 1" and recording how many dice were remaining. Sample Data 25 20 y = -0.7285x + 15.145 y = 17.356e-0.126x 15 10 5 10 15 20 25 -5 Rolls Dice Remaining
Step by Step Solution
3.40 Rating (159 Votes )
There are 3 Steps involved in it
Solution Solution a The given straight line is going ... View full answer

Get step-by-step solutions from verified subject matter experts