Question: Below is an example of how the template should be. You do not need to calculate any costs. Just find the two plans and the

Below is an example of how the template shouldBelow is an example of how the template should be.

Below is an example of how the template should
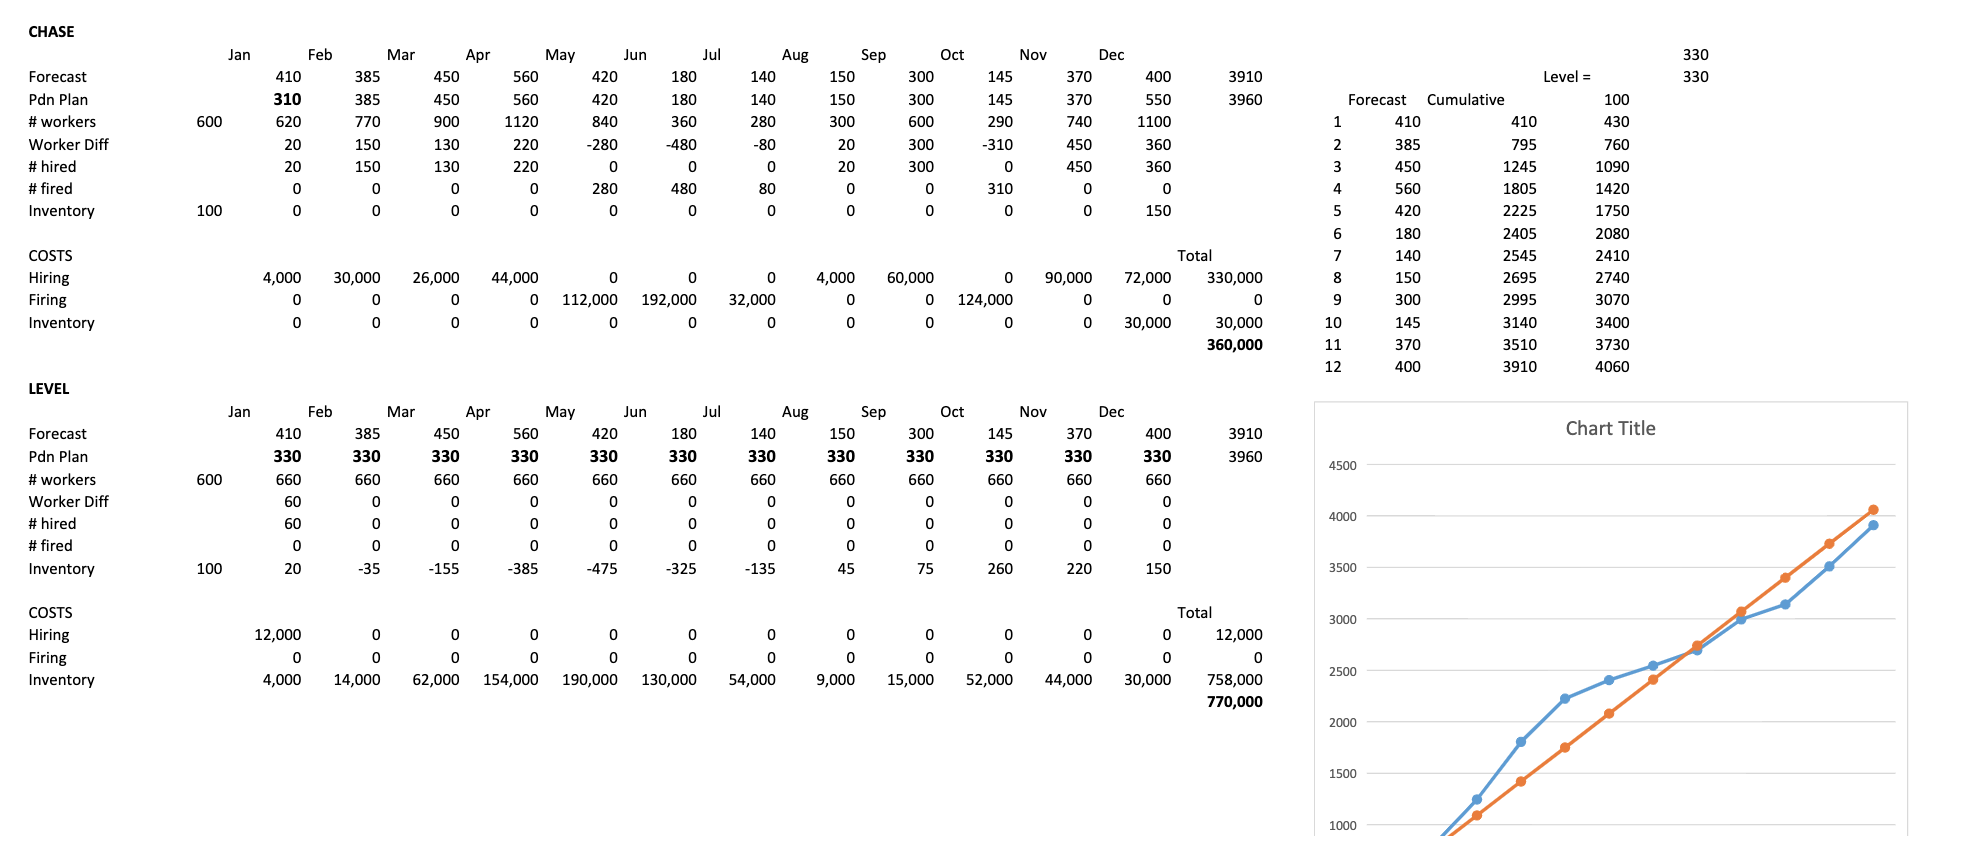
You do not need to calculate any costs. Just find the two plans and the monthly ending inventory.

ABC Manufacturing is developing their 2022 SOP. The sales plan is already developed, using the forecast obtained from Demand Management and is as follows: (the numbers are in 1000's) Jan 420 Feb 375 Mar 425 Apr May Jun 600 200 100 Jul 150 Aug Sep 250 420 Oct 390 Nov 420 Dec 450 Other problem parameters are: There is an initial inventory of 100,000 units. There is a required ending inventory of 220,000 units. This means that the operations plan should be appropriately augmented to leave this ending inventory in December 2022. Use Excel to: 1. Develop a Chase plan 2. Develop a Level plan CHASE Jan 330 330 400 Feb 410 310 620 Mar 385 385 770 150 150 Apr 450 450 900 130 130 May 560 560 1120 220 220 Jul 180 180 360 Forecast Pdn Plan #workers Worker Diff # hired # fired Inventory 3910 3960 Jun 420 420 840 -280 0 Aug 140 140 280 -80 Sep 150 150 300 20 Nov 145 145 290 -310 Oct 300 300 600 300 300 0 600 550 1100 Dec 370 370 740 450 450 0 20 -480 360 385 0 0 20 0 360 20 0 0 0 0 280 480 80 0 310 0 150 100 0 0 0 0 0 0 0 0 0 0 0 Forecast Cumulative 1 410 410 2 795 3 450 1245 4 560 1805 5 420 2225 6 180 2405 7 140 2545 8 150 2695 9 300 2995 10 145 3140 11 370 3510 12 400 3910 Level = 100 430 760 1090 1420 1750 2080 2410 2740 3070 3400 3730 4060 0 COSTS Hiring Firing Inventory 4,000 0 30,000 0 26,000 0 44,000 0 4,000 0 0 32,000 0 60,000 0 90,000 0 112,000 192,000 0 124,000 0 Total 72,000 330,000 0 0 30,000 30,000 360,000 0 0 0 0 0 0 0 LEVEL Jan Jul Nov Mar 385 Aug 140 180 3910 Chart Title Feb 410 330 660 Apr 450 330 660 May 560 330 660 Jun 420 330 660 Sep 150 330 660 Oct 300 330 660 Dec 370 330 660 330 330 145 330 660 330 400 330 660 3960 4500 600 660 660 660 Forecast Pdn Plan # workers Worker Diff # hired # fired Inventory 60 0 0 0 0 0 0 0 0 0 0 0 60 0 0 0 0 0 0 0 0 0 4000 0 0 0 0 0 0 -385 0 0 0 0 0 0 100 20 -35 -155 -475 -325 -135 45 75 260 220 150 3500 3000 0 0 0 0 0 0 0 0 COSTS Hiring Firing Inventory 12,000 0 4,000 0 0 62,000 0 154,000 0 190,000 0 9,000 0 15,000 0 44,000 Total 0 12,000 0 0 30,000 758,000 770,000 2500 14,000 130,000 54,000 52,000 2000 1500 1000

Step by Step Solution

There are 3 Steps involved in it

1 Expert Approved Answer
Step: 1 Unlock blur-text-image
Question Has Been Solved by an Expert!

Get step-by-step solutions from verified subject matter experts

Step: 2 Unlock
Step: 3 Unlock

Students Have Also Explored These Related General Management Questions!